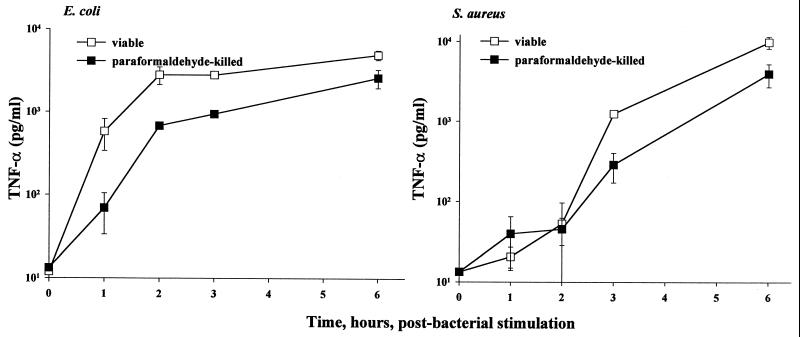
FIG. 3.
Comparisons of TNF-α secretions from paraformaldehyde-killed versus viable E. coli- and S. aureus-stimulated mouse macrophages from 0 to 6 h. Macrophage preparation and the TNF-α assay were as described for Fig. 1. E. coli O111:B4 and S. aureus M concentrations: paraformaldehyde-killed, 107 CFU/ml; viable, 5 × 10⁵ CFU/ml. Data are means ± SEM for three independent experiments. For the data lacking error bars, variation was too small to indicate.

