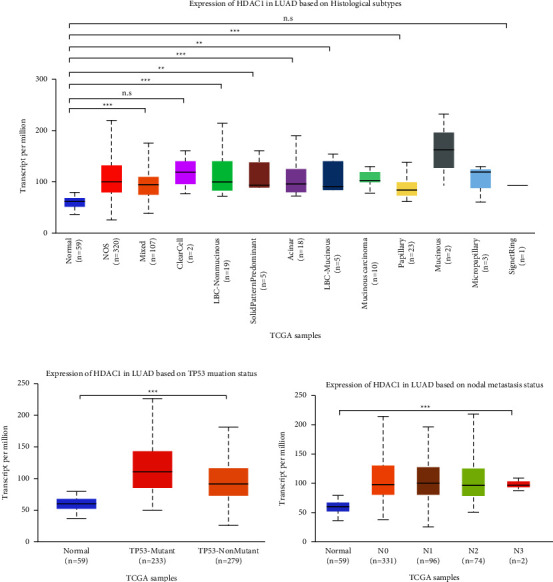
Figure 4.

HDAC1 mRNA expression obtained by mRNA sequencing method. (a) Comparison of HDAC1 mRNA levels in normal individuals and in various histological subtypes (NOS, mixed, clearcell, LBC-nonmucinous, etc.). (b) Comparison of HDAC1 mRNA levels in normal individuals and in different lymph node metastatic states. (c) Comparison of HDAC1 mRNA expression levels in normal individuals and TP53 mutated and TP53 unmutated conditions. ∗, P < 0.05; ∗∗, P < 0.01; ∗∗∗, P < 0.001; n.s: no significant.
