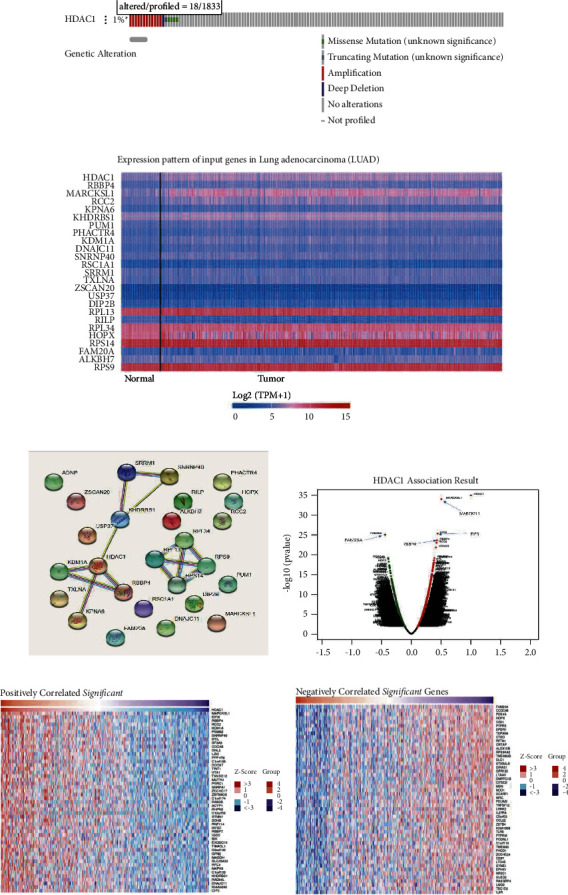
Figure 8.

HDAC1 mRNA expression and molecular network analysis of DNA genetic changes and all genes in the related gene set at the cBioPortal website. (a) HDAC1 mutation frequency in LUAD, dark red represents amplification, blue represents deep silencing, green represents missense mutation (meaning unknown), and gray represents no mutation. (b) Heat map of transcriptional expression of this gene set. The data of mRNA expression of this gene set were obtained from LUAD tissue samples of TCGA. On the left is a normal control sample, and on the right is a tumor tissue sample, showing increased expression in red and decreased expression in blue. (c) 25 genes set network construction. (d) Correlation Pearson chart of gene set composed of 25 genes related to HDAC1. This chart represents a visual display of many genes related to the HDAC1 gene. The left side of the abaxial axis is a negative value (negative correlation), and the right side is a positive value (positive correlation). (e)–(f) Heat map of HDAC1 positive and negative associated gene sets. The left side of each graph is a positive correlation, and the right side is a negative correlation. In the graph, the darker the red is, the higher the correlation, while the darker the blue is, the lower the correlation.
