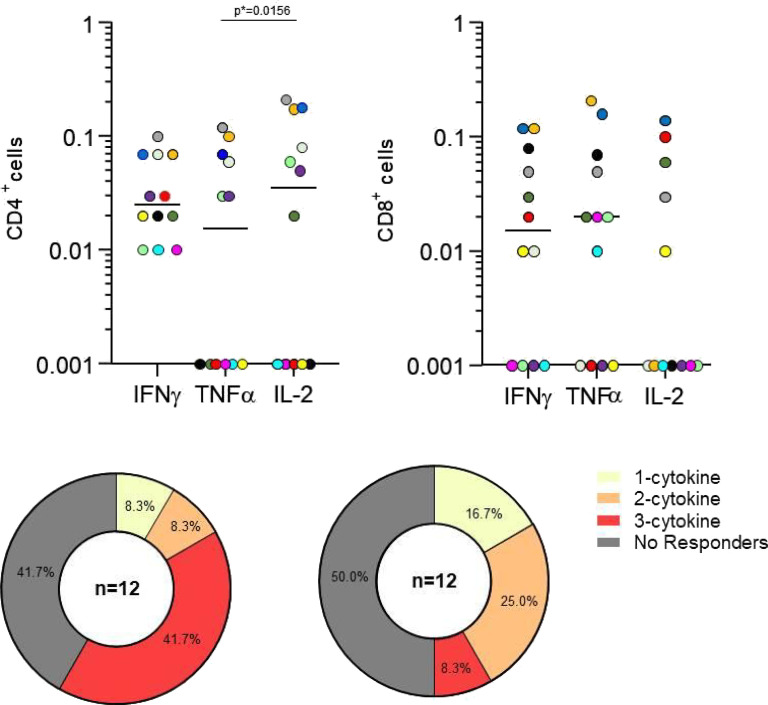
Figure 3.
(a) Spike-specific T-cell response 6 months after first vaccination cycle. Different colors indicate different patients. Legend: Percentages of CD4+ and CD8+ T cells producing IFNγ, TNFα, IL2 after Spike stimulation of purified PBMCs are shown. Statistical differences were calculated by Wilcoxon signed-rank test. (b) Functional profile of CD4+ and CD8+ T cells according to the number of cytokines produced (IFNγ, TNFα, IL2). The threshold for a positive T-cell response was set at 0.05% for each cytokine.

