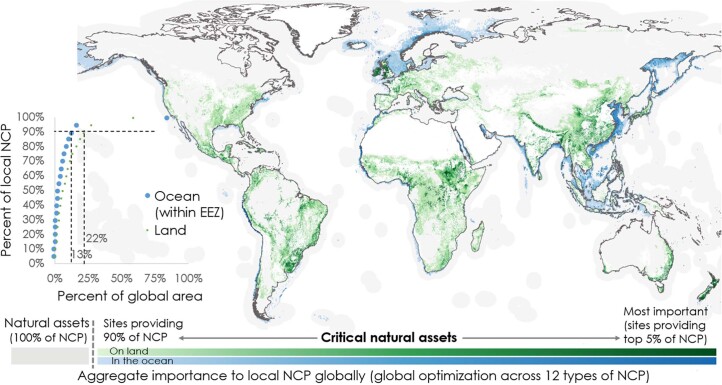
Extended Data Fig. 5. Critical natural assets identified through optimization at the global level of 12 ‘local’ NCP.
As in Fig. 1, the NCP accumulation curve reflects the total area required to maintain target levels of all 12 local NCP (but in this case optimized globally, not within each country), with dotted lines denoting the area of critical natural assets (90% of the 12 NCP listed in Fig. 1a in 22% of land area and 13% of EEZ areas). The map shows critical natural assets for local NCP, with darker shades connoting greater contribution to aggregate NCP.

