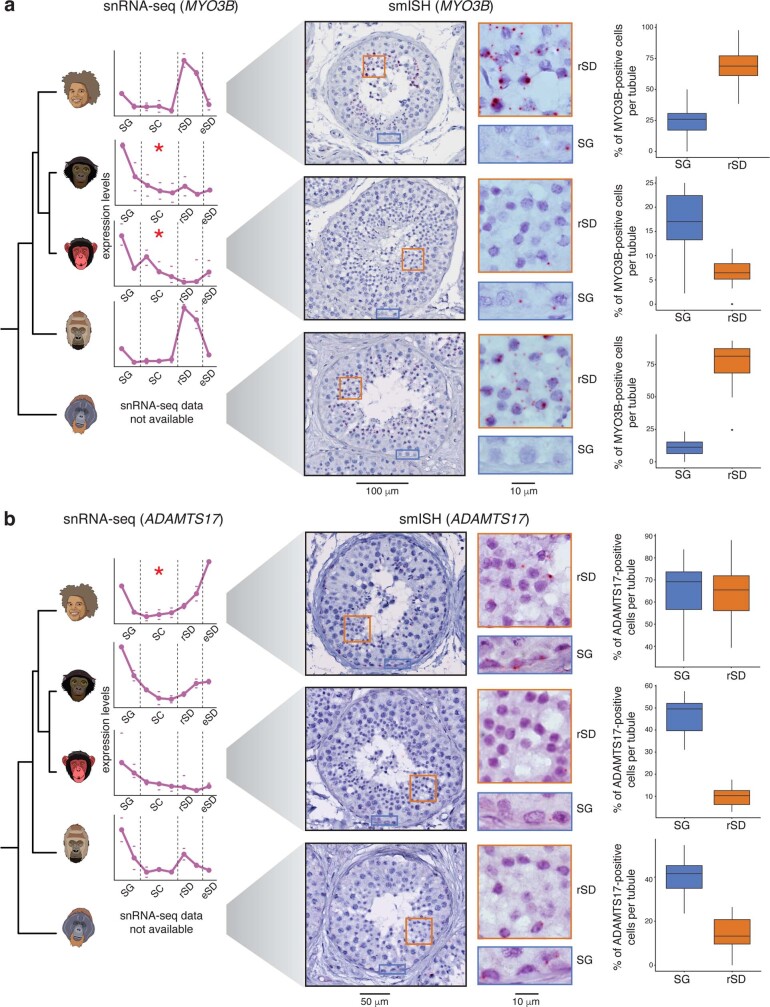
Extended Data Fig. 4. Examples of gene expression trajectory changes along primate spermatogenesis validated by smISH.
Left: Median gene expression trajectory from snRNA-seq along spermatogenesis for human, bonobo, chimp., and gorilla (from top to bottom). For each replicate, mean expression levels across cells of a given cell type were calculated. Marks indicate values for the replicates with the highest and lowest mean expression levels, dots indicate the median of mean expression values of the replicates. There are two biological replicates for human, bonobo, and gorilla and three biological replicates for chimpanzee. Center: images of seminiferous tubule cross sections from human, chimp., and orangutan (from top to bottom) stained with smISH for MYO3B (a) and ADAMTS17 (b) using RNAScope. Red asterisks indicate on which branch a trajectory change was called. Examples of spermatogonia (SG) and round spermatids (rSD) closeups are provided for visualization purposes. Right: percentage of positive cells in SG and rSD from 10 tubules per section (n = 3 for human, n = 1 for chimp. and orangutan). Box plots represent the mean (central value) distribution of staining; upper and lower quartile (box limits) with whiskers at 1.5 times the interquartile range.

