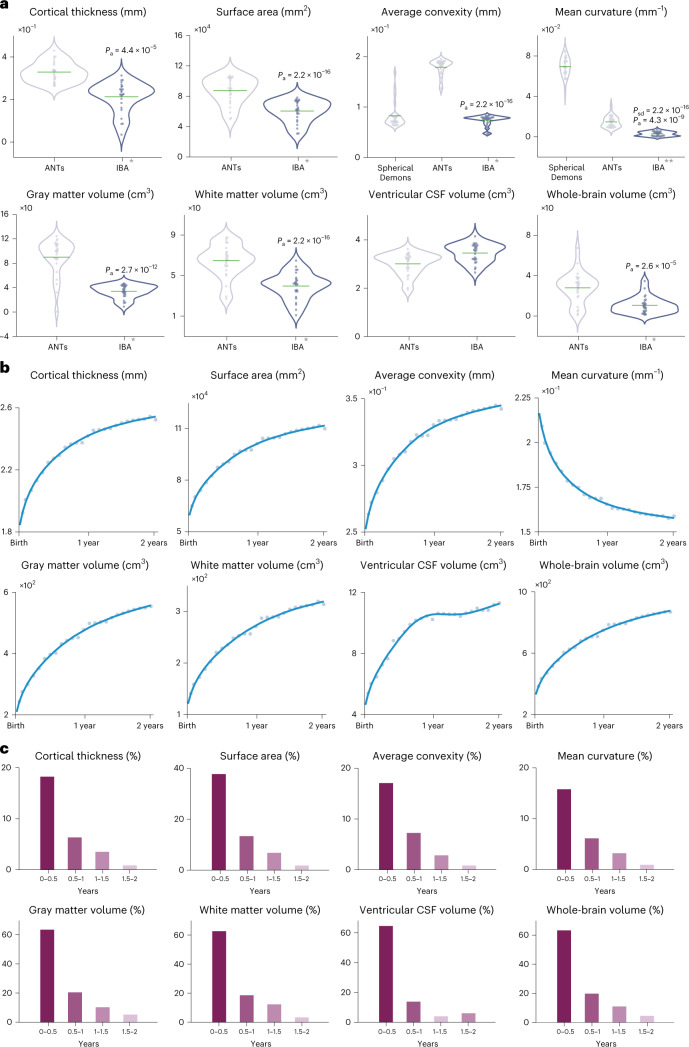
Fig. 4. Development of surface and volume.
a, Violin plots for absolute error of the developmental trajectories of surface and volumetric features, computed between the atlases and the individual subjects. The mean absolute error is marked by a green crossbar. A single star indicates that the mean error for the IBA is significantly different from ANTs (two-tailed paired t-test, Pa). A double star indicates that the mean error for the IBA is significantly different from both Spherical Demons (two-tailed paired t-test, Psd) and ANTs (two-tailed paired t-test, Pa). b, Developmental trajectories (adjusted R2 = 0.99) of white surface features and tissue volumes of the IBA. c, Surface and volumetric changes every six months.

