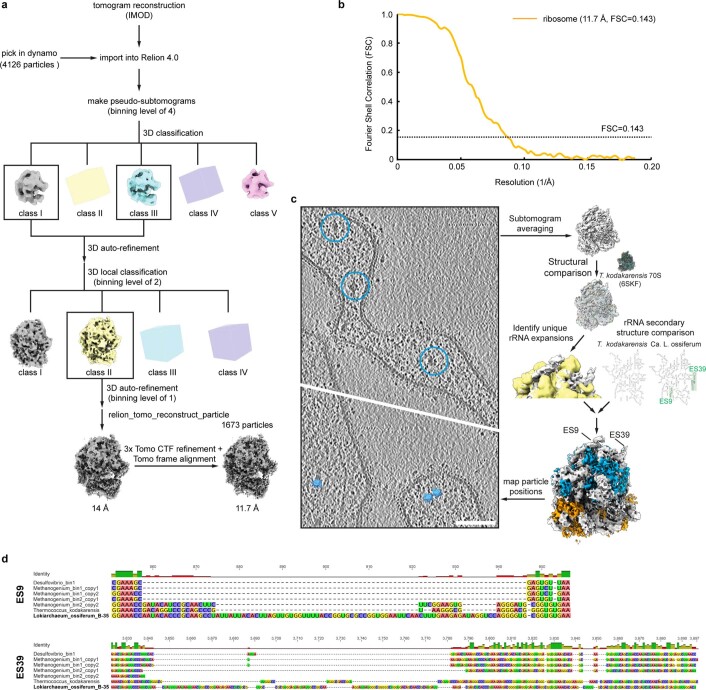
Extended Data Fig. 6. Sub-tomogram averaging of the ribosome and identification of rRNA expansion segments.
a. Flowchart for the sub-tomogram averaging strategy of the ribosome. For details see Methods. b. Gold-standard FSC curve of the sub-tomogram average. c. Scheme of the ribosome identification workflow. For details see Fig. 3 and Methods. d. Multiple sequence alignment of expansion segments (ESs) 9 and 39 of the LSU rRNA of L. ossiferum compared to sequences from T. kodakarensis and those present in the MAGs of the organisms in the enrichment culture (Desulfovibrio_bin1: 44 contigs, 100% complete, 0% contamination; Methanogenium_bin1: 56 contigs, 98.7% complete, 2.6 % contamination; Methanogenium_bin2: 37 contigs, 98.7% complete, 1.9% contamination). The alignment reveals that ESs are only present in L. ossiferum.

