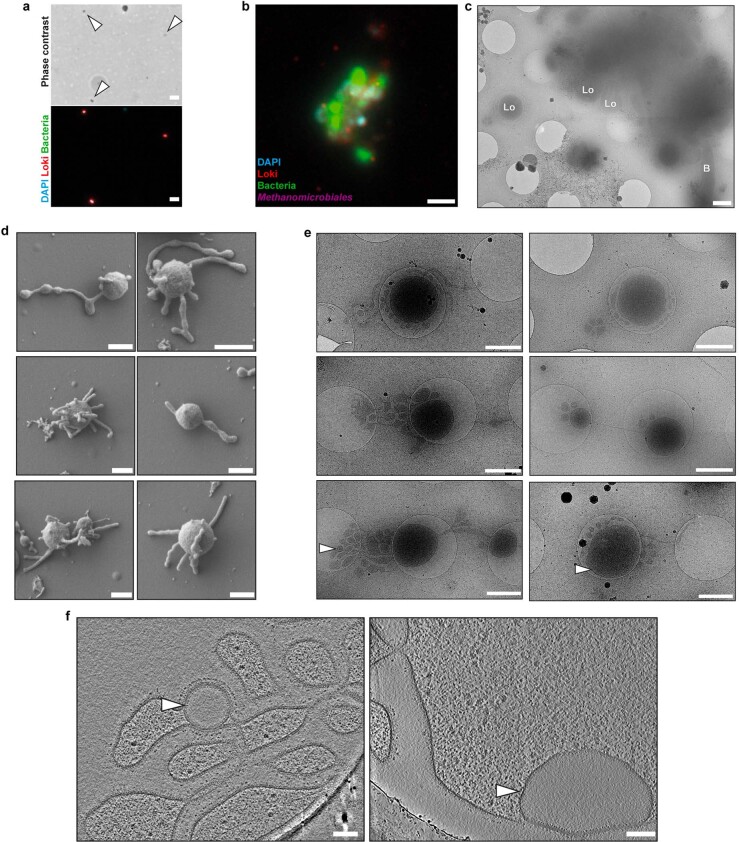
Extended Data Fig. 7. Potential cell-cell interactions, variability of cell shape and rare vesicles observed in cryo-tomograms.
a. FISH analysis of the enrichment cultures with DAPI (cyan) and nucleotide probes targeting Lokiarchaea (red) and bacteria (green) and the corresponding phase contrast image showing isolated L. ossiferum cells. The FISH experiments were performed five independent times, with similar results. Bar: 2 µm. b/c. Aggregates of cells were infrequently observed during imaging of the enrichment culture. FISH analysis (b) with DAPI (cyan) and nucleotide probes targeting Lokiarchaea (red), bacteria (green) and Methanomicrobiales (purple) shows potential interactions of cells from different species. A low-magnification 2D EM image (c) shows L. ossiferum cells (Lo) next to a bacterial cell (B). Since the core of the cell assembly exceeded the thickness limitation of cryoET, no cryo-tomograms could be collected. Bars: 2 µm (b), 1 µm (c). d/e. Representative SEM (d) or low-magnification cryo-TEM images (e) showing different morphologies of L. ossiferum cells (n = 2 independent cultures). Both datasets revealed individual cell bodies that were always connected to at least one longer protrusion or vesicular structure. White arrowheads indicate the position of intracytoplasmic vesicles shown in f. Bars: 500 nm (d), 1 µm (e). f. Slices of cryo-tomograms (slice thickness 21.42 nm) showing the two intracytoplasmic vesicles observed in L. ossiferum protrusions (left) or a cell body (right), indicated by white arrowheads. Both vesicles seem fully enclosed by a membrane and show a low-density lumen. Bars: 100 nm.

