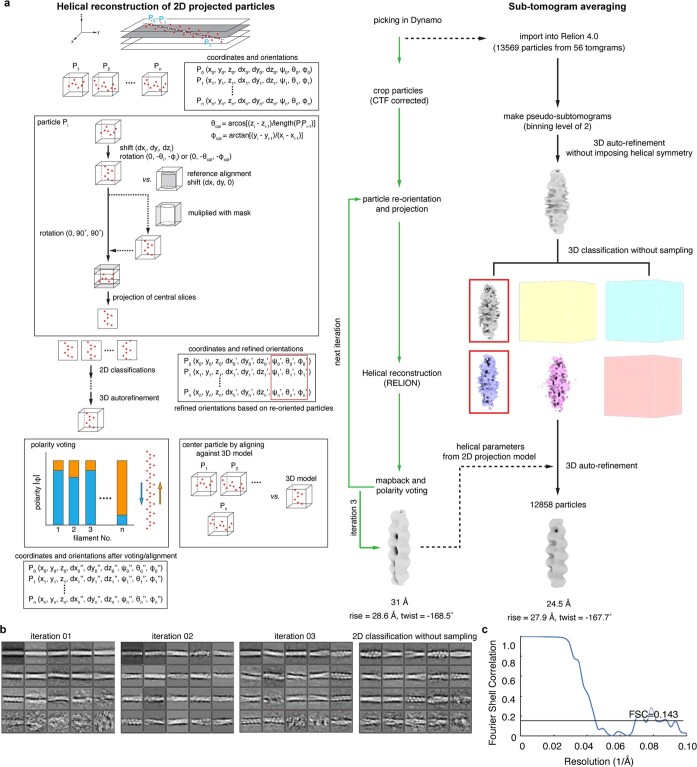
Extended Data Fig. 9. Analysis of cytoskeletal filaments by helical reconstruction of 2D-projected particles and sub-tomogram averaging.
a. Flowchart of the in situ reconstruction of the cytoskeletal filament. For details see Methods. b. 2D classification of 2D-projected particles after different iterations of the reconstruction workflow and 2D classes obtained after the last iteration without sampling. c. Gold-standard FSC curve of the reconstruction after sub-tomogram averaging.

