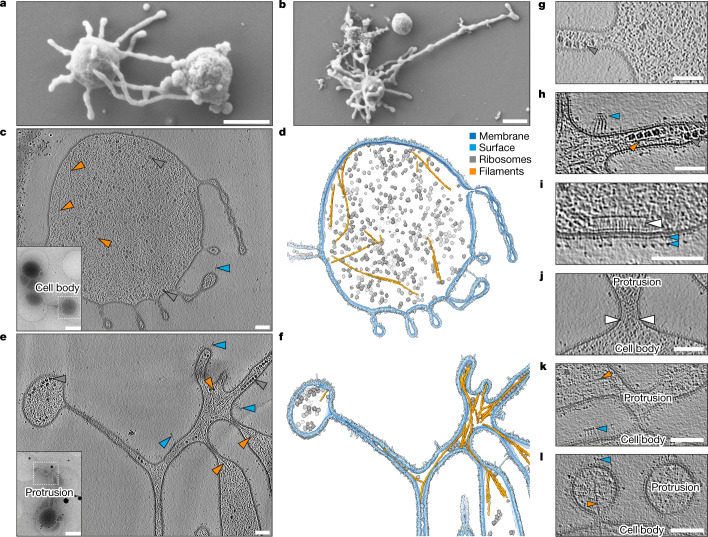
Fig. 4. Complex and variable architecture of ‘Ca. L. ossiferum’ cells.
a,b, SEM imaging of fixed ‘Ca. L. ossiferum’ cells showed small coccoid cells with extensive protrusions. Example micrographs from n = 2 independent cultures are shown. See also Extended Data Fig. 7d. For a and b, scale bars, 500 nm. c–f, Slices through cryo-tomograms (c,e; thickness, 9.02 nm) and the corresponding neural-network-aided 3D volume segmentations (d,f) of two different ‘Ca. L. ossiferum’ cells. The insets in c and e show 2D overview images of the two different target cells. Cell bodies (c,d) and networks of protrusions (e,f) both contained ribosomes (grey arrowheads), cytoskeletal filaments (orange arrowheads) and complex surface densities (blue arrowheads). Note that e and f show the same cell as in Fig. 3c. For c and e, scale bars, 100 nm (tomogram) and 1 µm (2D overview). g,h, Expanded views of slices from tomograms in c and e, showing ribosome chains, complex surface proteins and filaments (colour code as in c–f) in a junction of a cell bridge (g) and a constricted part of the protrusion network (h). For g and h, scale bars, 100 nm. i–l, Slices through cryo-tomograms showing a putative chemoreceptor array (i; indicated by a white arrowhead) and different types of connections between cell bodies and protrusions (j–l). The coloured arrowheads indicate filaments and surface structures as defined for c–f. The white arrowheads in j indicate weak densities at the neck of the junction. Slice thickness, 9.02 nm (j) or 10.71 nm (i and k–l). For i–l, scale bars, 100 nm.

