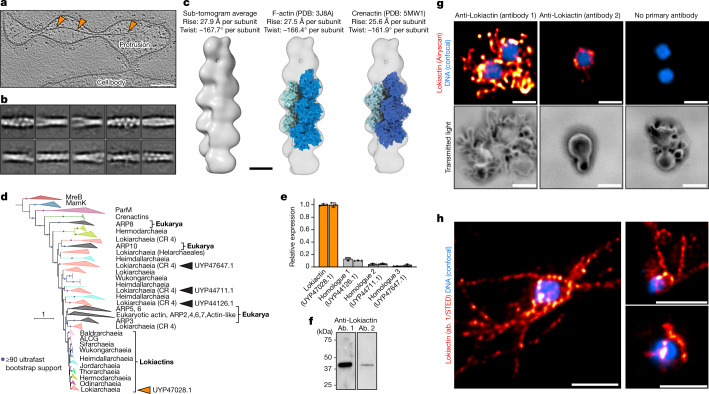
Fig. 5. Lokiactin is involved in cytoskeleton formation.
a, Slice through a cryo-tomogram showing a cytoskeletal filament inside a protrusion at higher magnification. Slice thickness, 5.36 nm. Scale bar, 100 nm. b, Filament segments were extracted from cryo-tomograms for structural analysis. 2D classes that were obtained after helical reconstruction of 2D-projected filament particles are shown, indicating a twisted double-stranded architecture. Box size, 34.3 × 34.3 nm. See also Extended Data Fig. 9. c, Sub-tomogram average (24.5 Å resolution) of the cytoskeletal filament displaying helical parameters with a high similarity to eukaryotic F-actin and archaeal Crenactin. Structural docking shows that an F-actin-like filament is consistent with the reconstructed map. See also Extended Data Fig. 9. Scale bar, 50 Å. d, Maximum-likelihood phylogenetic tree of actin family proteins. The ‘Ca. L. ossiferum’ genome encodes four homologues. One homologue (GenBank: UYP47028.1) clusters together with other Asgard archaeal Lokiactins (group indicated by orange arrowhead), which form a sister group to eukaryotic actin. The three other homologues (from top to bottom: GenBank UYP47647.1, UYP44711.1 and UYP44126.1) cluster with other Asgard archaeal and eukaryotic ARPs (groups indicated by the black arrowheads). The tree was rooted with the MreB protein family. CR 4, subgroup from within Lokiarchaeia. e,f, Lokiactin is expressed in the enrichment culture. e, Transcription of the four actin homologues was analysed using RT–qPCR analysis of two enrichment cultures, indicating the highest levels of transcripts for Lokiactin. The mean expression levels normalized to Lokiactin are shown. The error bars indicate the s.d. of three technical replicates. f, Expression was also detected using western blotting analysis of a cell lysate obtained from the enrichment culture (representative result from n = 2 independent samples). Gel source data are provided in Supplementary Fig. 1. Two antibodies (ab.) were used that were raised against different ‘Ca. L. ossiferum’ Lokiactin-specific peptides. g,h, Immunofluorescence staining of ‘Ca. L. ossiferum’ cells with two different Lokiactin-specific antibodies analysed using Airyscan (g) or stimulated emission depletion (STED) (h) imaging (representative images of n = 3 (g) or n = 2 (h) independent preparations). The distribution of fluorescent signal indicates the presence of Lokiactin-based cytoskeletal structures in cell bodies and protrusions, being consistent with observations from cryo-tomograms. The top row of g shows single slices of the fluorescent DNA signal (blue, Hoechst stain, LSM-Plus-processed confocal) and the Alexa Fluor 647-labelled secondary antibodies (red/orange, jDCV-processed Airyscan). The bottom row of g shows the minimum intensity z-projections of the transmitted light channel to indicate the cell shape. The control (right column) was probed with only secondary antibodies (the contrast in the top row was adjusted equally). The images in h show single slices of representative deconvolved STED images detecting Lokiactin (red/orange, abberior STAR 580-labelled secondary antibodies) and DNA (blue, SPY505-DNA). For g and h, scale bars, 1 µm.

