. 2022 Dec 22;8(4):544–565. doi: 10.3934/microbiol.2022035

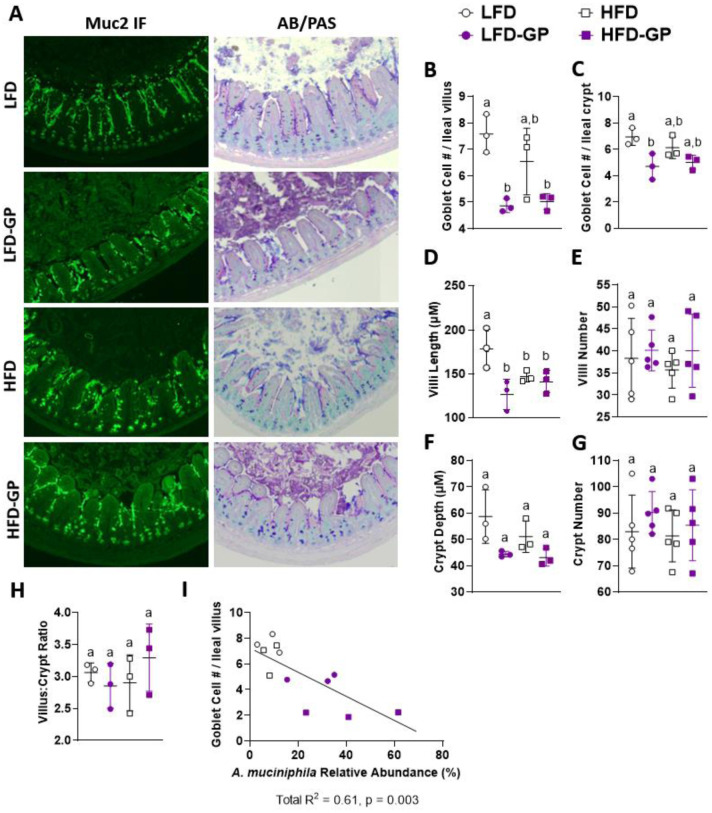
Figure 3. Ileum phenotypes. (A) Representative images (one mouse selected from n = 3–5 mice/group) of ileal Muc2 IF (green) and AB/PAS stains (pink, purple) at week 12 at magnification 14×. Average ileal goblet cell number (B) per villus and (C) per crypt quantified from AB/PAS stains. Average (D) villus length, (E) villi number per cross section, (F) crypt depth, (G) crypts per cross section and (H) villus-to-crypt ratio quantified from H & E stains. (I) Pearson correlation showing cecal A. muciniphila relative abundance verses goblet cell number per villus. Statistical significance between four groups of parametric data was determined via two-way ANOVA, followed by Holm-Sidak's multiple-comparisons test. Different letters denote statistical significance. p < 0.05 was considered significant. Each symbol denotes a single animal.

Figure 3.