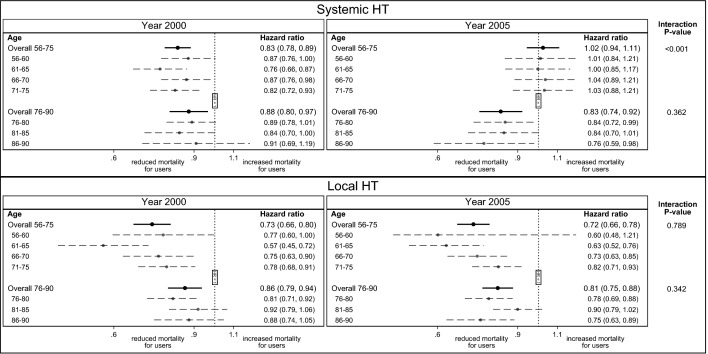
Figure 2.
Forest plot illustrating the association between mortality (shown on a log scale) and hormone therapy (HT), local and systemic HT respectively, in singletons and shown separately for each age group in the years 2000 and 2005. It shows hazard ratio and corresponding 95% confidence interval. For those aged 56–75 the association was adjusted for education but not for those aged 76–90, due to education was missing for 63% in this age group in 2000. Difference in overall association between HT use in 2000 and 2005 is estimated using an interaction p-value.

