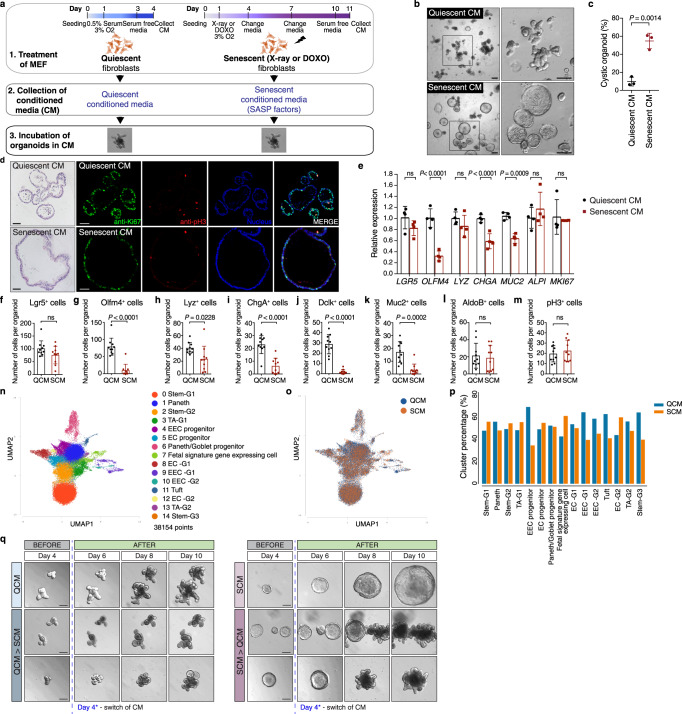
Fig. 1. Conditioned medium from senescent fibroblasts causes cystic morphology of mouse intestinal organoids.
a Schematic showing induction of quiescence and senescence in fibroblasts, conditioned media collection, and organoid culture in conditioned media. The figure was created with BioRender.com. b Representative images of organoids after 5 d of culture in conditioned media. Enlarged images (boxed area) are shown at the right. Scale bar, 200 μm. c Quantification of data from (b). The percentage of cystic organoids in organoids cultured in conditioned media is shown (mean ± s.d.; two-tailed t-test). Each dot represents a result from organoids established from a mouse, 3 biological replicates per experiment (n = 3). d H&E staining (left column) and immunostaining of paraffin-embedded organoids. Immunostaining for Ki67 (green) and phospho-Histone H3 (red) in intestinal organoids cultured in conditioned media and stained with Hoechst (blue). Scale bar, 50 μm. e Gene expression in organoids exposed to SCM determined by qPCR and represented as a ratio relative to organoids exposed to QCM (mean ± s.d.; n = 4; two-tailed t-test). f–m Numbers of cells expressing the listed markers in organoids exposed to QCM or SCM (mean ± SEM; n = 10; two-tailed t-test). n UMAP of pooled snRNA-seq data of nuclei from QCM and SCM exposed organoids colored by cell-type annotation (right). o UMAP showing contribution of nuclei from QCM and SCM exposed organoids labeled in blue and orange, respectively. p Relative contribution of cells from QCM and SCM exposed organoids to each cluster. Cells from QCM and SCM exposed organoids were labeled in blue and orange, respectively. q Representative images of organoids taken every 2 days starting on day 4. From day 0 to 4, organoids were cultured in quiescent conditioned media (left panel) and senescent conditioned media (right panel). On day 4, quiescent-conditioned media was changed to senescent-conditioned media (left bottom panel), whereas senescent-conditioned media was changed to quiescent-conditioned media (right bottom panel). In all conditions, media was changed every other day. Scale bars, 100 μm. See also Fig. S1. Source data are provided as a Source Data file.

