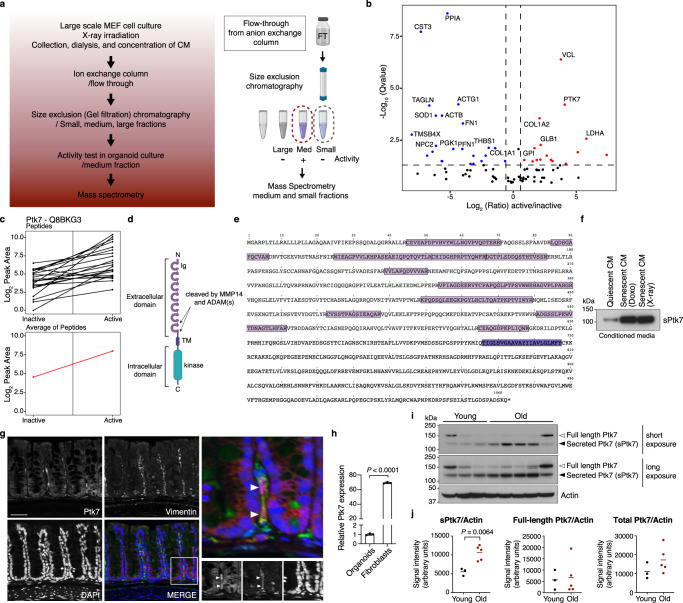
Fig. 2. Identification of Ptk7 as a factor that causes cystic organoid phenotype.
a Schematic showing conditioned media preparation, column purification, activity test, and mass spectrometry (MS). The figure was created with BioRender.com. b Volcano plot representing the statistical significance and protein abundance ratios between medium (active) and small (inactive) fractions. Dashed lines depict a q = 0.05 cutoff (horizontal) and 1.5-fold difference cutoffs (vertical). Proteins that are present highly in medium (active) and small (inactive) fractions are represented in red and blue, respectively. Proteins with q < 0.01 and more than 1.5-fold difference are labeled. c Graphs showing peptide peak area profiles for Ptk7. Each Ptk7 peptide detected is shown as a black line, indicating the peak area measurements for the inactive and active fractions. The average of all Ptk7 peptides is presented as a red line. d Schematic representation of the Ptk7 protein domain structure. Ig: Immunoglobulin-like loops (lilac), TM: a transmembrane region (purple), and an inactive tyrosine kinase domain (blue). e A graphic representation of the list of peptides detected by MS. Ptk7 peptide sequences detected by MS in lilac and the transmembrane domain in purple. f Western blot for Ptk7 in conditioned media collected from quiescent and doxorubicin- or irradiation-induced senescent MEFs. Conditioned media corresponding to the same number of cells was loaded. Increased shedding of Ptk7 (soluble form of Ptk7; sPtk7) was detected in senescent conditioned media. g Immunofluorescence staining of Ptk7 (red) and stromal cell marker Vimentin (green) in the large intestine. Nuclei were counter stained with DAPI (blue). Scale bar: 50 μm. h The relative PTK7 expression in intestinal organoids and fibroblasts (mean ± s.d.; n = 3; two-tailed t-test). i Western blots of Ptk7 in the large intestine extract from young and old mice. Blot images of two different exposure times are shown. Each lane presents tissue lysate from one mouse (n = 3 for young mice, n = 5 for old mice). Actin was used as loading control. j Quantification of data from (i). Ptk7 and Actin protein levels were analyzed by ImageJ. Ptk7 protein levels normalized to Actin are shown as mean ± s.d. Two-tailed t-test was used for statistical analysis. See also Fig. S2. Source data are provided as a Source Data file.

