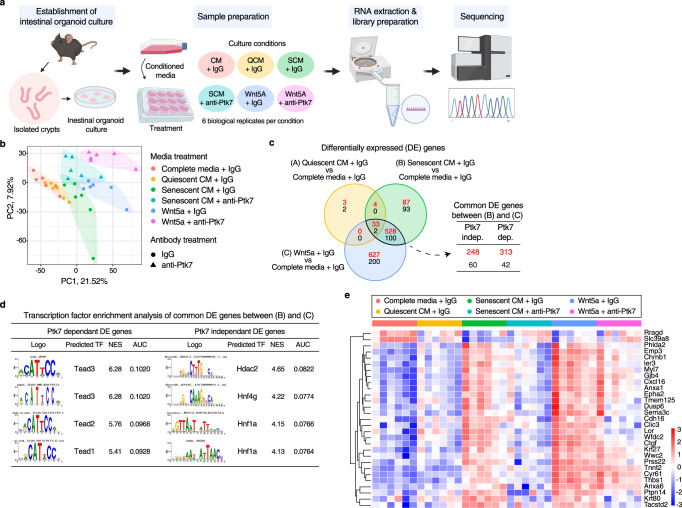
Fig. 6. Transcriptomes of organoids shows enrichment of TEAD binding motifs among Ptk7-dependent DE genes.
a A diagram showing the workflow of intestinal organoid culture, media treatments, sample preparation, and RNAseq. The figure was created with BioRender.com. b Principal component analysis (PCA) of RNAseq results from the indicated organoids. Each point represents individual samples, and sample groups are indicated by using different colors as indicated in the legend provided. c Venn diagram showing overlap in differentially expressed genes (DEGs) between the indicated conditions. Numbers of DEGs upregulated and downregulated are shown in red and black, respectively. FDR < 0.05 and fold change >1.5 were used to acquire the list of DEGs. Overlapping DEGs from SCM and Wnt5a treated organoids were further divided into two groups by Ptk7 dependency. d Transcription factor enrichment analysis of common DEGs from (c) using i-cisTarget. Highly enriched motifs and predicted transcription factors for Ptk7-dependent and independent DEGs were ranked by normalized enrichment score (NES). e Heatmap showing expression of selected Ptk7-dependent DEGs with TEADs binding motifs in different conditions. Heatmaps of Ptk7-dependent DEGs with different TEAD binding motifs (TEAD 1–4) are found in Supplementary Fig. 6a–d. See also Fig. S6.

