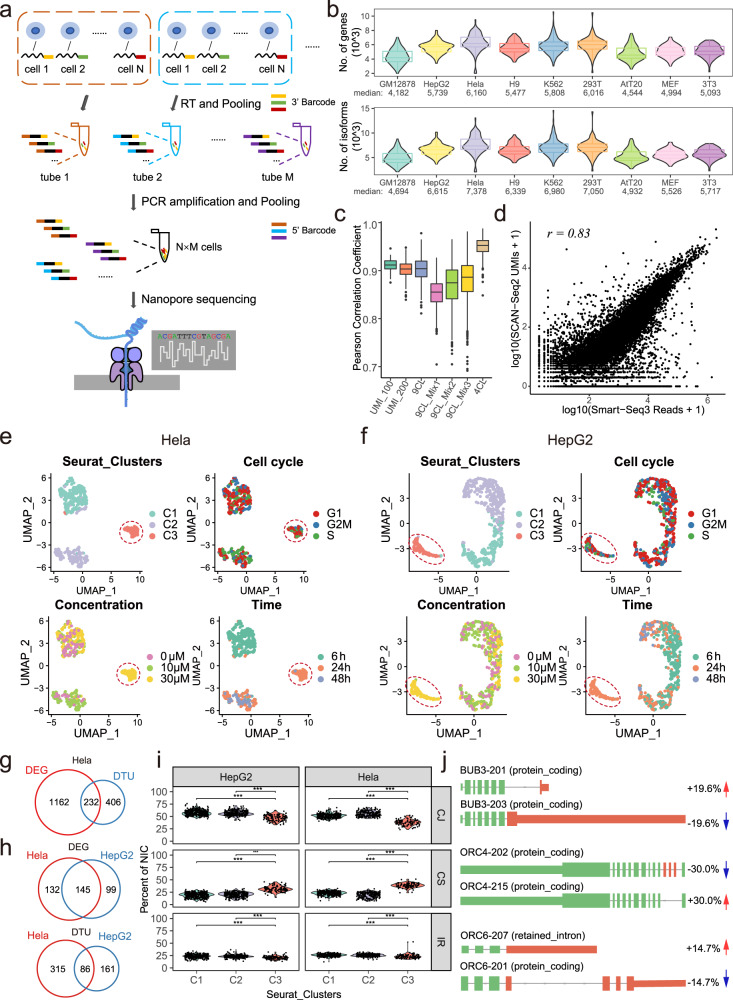
Fig. 1. SCAN-seq2 technical performances and analysis of Isoginkgetin (IGG) responses in cancer cell lines.
a Schematic diagram of SCAN-seq2 library construction. N different single cells are labeled with 3′ barcode during reverse transcription and pooled into the same tube for PCR amplification. M different tubes are pooled together and sequenced with Nanopore platform, allowing parallel sequencing of N×M cells. b Number of detected genes (top) and isoforms (bottom) in 852 cells from library 9CL. Median values are labeled under each cell line. c Pearson correlation of ERCC concentration and sequenced UMIs in each library. d Correlation between gene expression quantification of SCAN-seq2 and Smart-seq3 in 293 T cells. Single cells are aggregated into pseudo bulk for comparison. e, f UMAP embeddings of Hela (e) and HepG2 (f) cells after IGG treatment at different concentration and time. Cells are colored by unsupervised clustering results (top left), cell cycle phase (top right), IGG concentration (bottom left) and time of treatment (bottom right). IGG-responsive clusters are highlighted in red circles. g Venn diagram showing the overlap in upregulated differentially expressed genes (DEGs) and differential transcript usage (DTU) in IGG responsive cluster of Hela and HepG2 cells. h Venn diagram of DEGs and genes with significant DTU in IGG-responsive cluster of Hela cells. i Fraction of each subcategory for NIC transcripts in different clusters. P values are calculated by two-tailed Wilcoxon rank-sum test. ***P < 0.001. j Examples of genes with significant differential transcript usage in IGG responsive cluster. Exons with different usage are highlighted in red.

