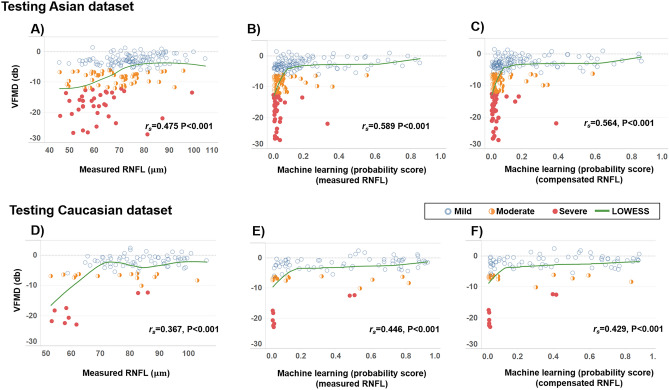
Figure 2.
Scatter plots showing the associations between the visual field mean deviation (VFMD) and measured retinal nerve fiber layer (RNFL) thickness for (A) Asian and (D) Caucasian test datasets. (B) and (E) show the associations between VFMD, and the probability score generated by a machine learning (ML) model using measured RNFL thickness, where a lower score indicates greater severity of glaucoma. (C) and (F) show the associations between VFMD, and the probability score generated by a ML model using compensated RNFL thickness, where a higher score indicates greater severity of glaucoma. Spearman’s correlation coefficient ρ and LOWESS curves are indicated for the corresponding variables in each plot.

