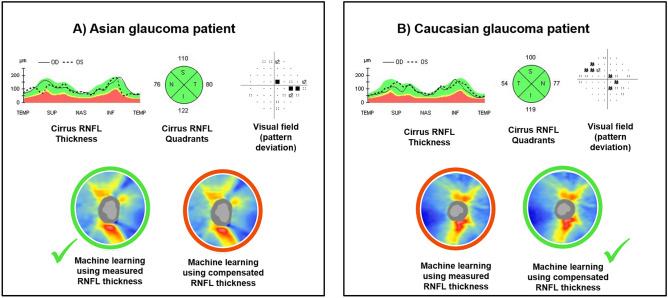
Figure 3.
Representative glaucoma cases showing the diagnostic performances of the measured retinal nerve fiber layer (RNFL), machine learning model using measured RNFL thickness, and machine learning model using compensated RNFL thickness. Case (A) is an Asian glaucoma patient, while Case (B) is a Caucasian glaucoma patient. The Cirrus RNFL thickness maps indicate a reduction in the RNFL thickness in the superior and inferior regions in Case (A), while it shows a reduction in the superior regions in Case (B). However, the Cirrus quadrant analyses show a normal RNFL probability color code in all quadrants in both cases. The output prediction of both compensation and machine learning approaches are color-coded, where the red circle indicates wrong prediction, and the green circle indicates correct prediction. The machine learning model measured RNFL thickness correctly predicted Case (A) with glaucoma while the machine learning model using compensated RNFL thickness correctly predicted Case (B) with glaucoma.

