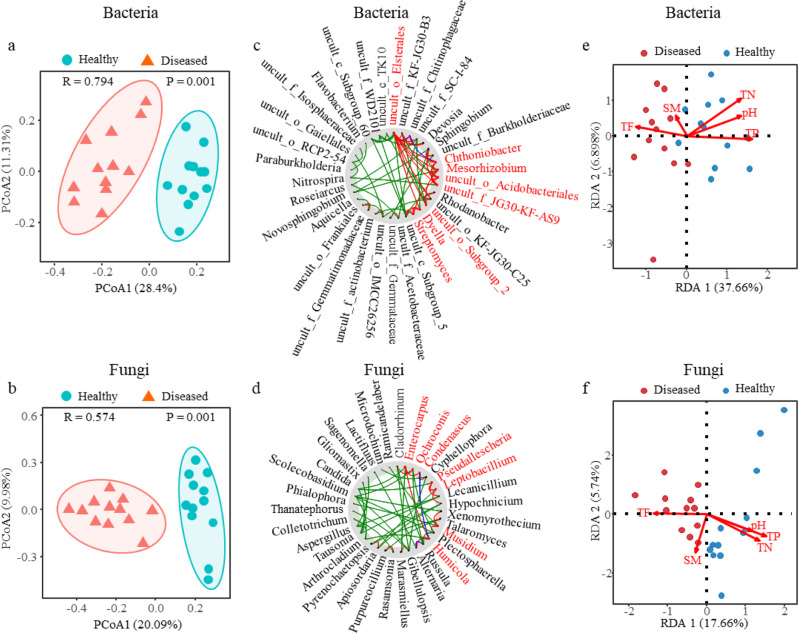
Fig. 4. Analyses of rhizosphere microbiome and soil property.
a, b Principal coordinate analysis (PCoA) of bacterial community (a) and fungal community (b) in the rhizosphere soil between healthy (n = 12) and diseased (n = 12) plants based on the Bray-Curtis distance, showing the soil microbiomes associated with the healthy and diseased plants were clearly separated. Each symbol represents an individual. c, d NetShift analysis to identify potential driver taxa behind pathogen suppression based on bacterial (c) and fungal (d) networks of the rhizosphere microbiome. The node sizes are proportional to their scaled NESH (neighbor shift) scores, and a node is colored red if its betweenness increased from control to case. Large and red nodes denote particularly important driver taxa behind pathogen suppression, and the taxa names are shown in red. Edge (line) is assigned between the nodes; green edges, association present only in the diseased plant microbiome; red edges, association present only in the healthy plant microbiome; and blue, association present in both diseased and healthy plant microbiomes. e, f Redundancy analysis (RDA) investigating the relationship between bacterial (e) or fungal (f) communities and the soil properties. TN, total nitrogen; TP, total phosphorus; TF, total ferrum; SM, soil moisture; dots represent individual plants (n = 12).

