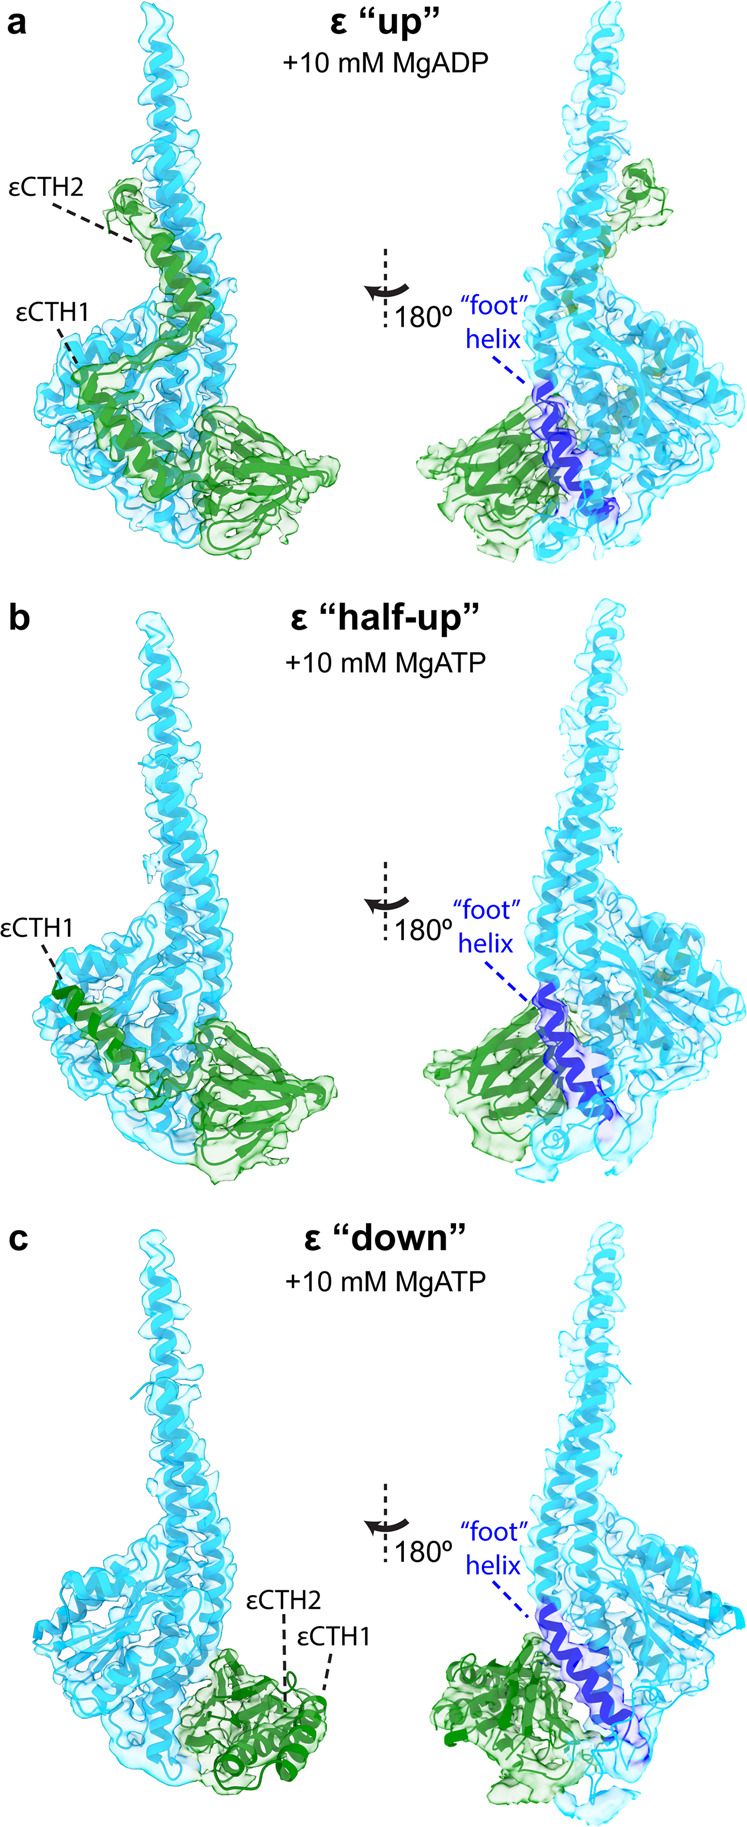
Fig. 3. E. coli F1Fo ATP synthase ε subunit in three conformational sub-states.

Cryo-EM maps (transparent surface) and molecular models (cartoon representation) of the E. coli F1Fo ATP synthase rotor in three conformation sub-states. Subunit γ in light blue and ε in green, with the foot helix of subunit γ labeled in dark blue. a The εCTD up sub-state observed after addition of 10 mM MgADP (PDB:6oqv; EMDB:2017119). b The εCTD half-up sub-state observed after addition of 10 mM MgATP (State 2 half-up in this study). c The εCTD down sub-state observed after addition of 10 mM MgATP (State 2 down in this study). See Supplementary Fig. 5 for close up views of the cryo-EM maps for the εCTD and γ foot.
