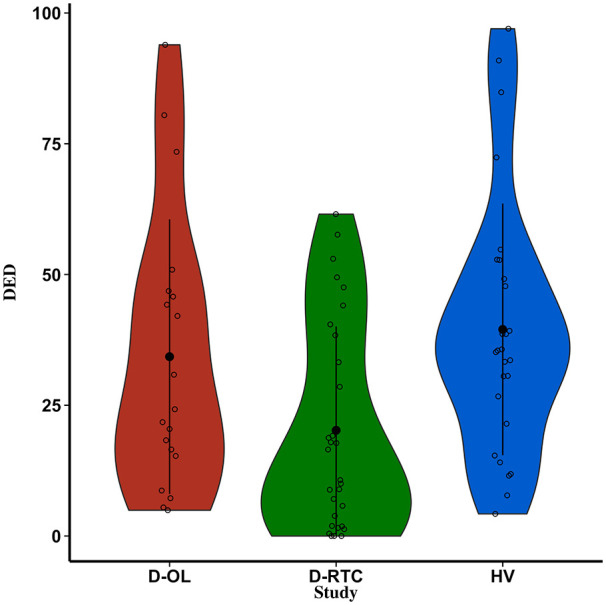
Figure 3.

DED across the three studies separately. Violin plots represent the distribution of scores. Black dots and bars represent the mean and standard deviation, respectively, while open circles represent individual participants. DED: dread of ego dissolution.
