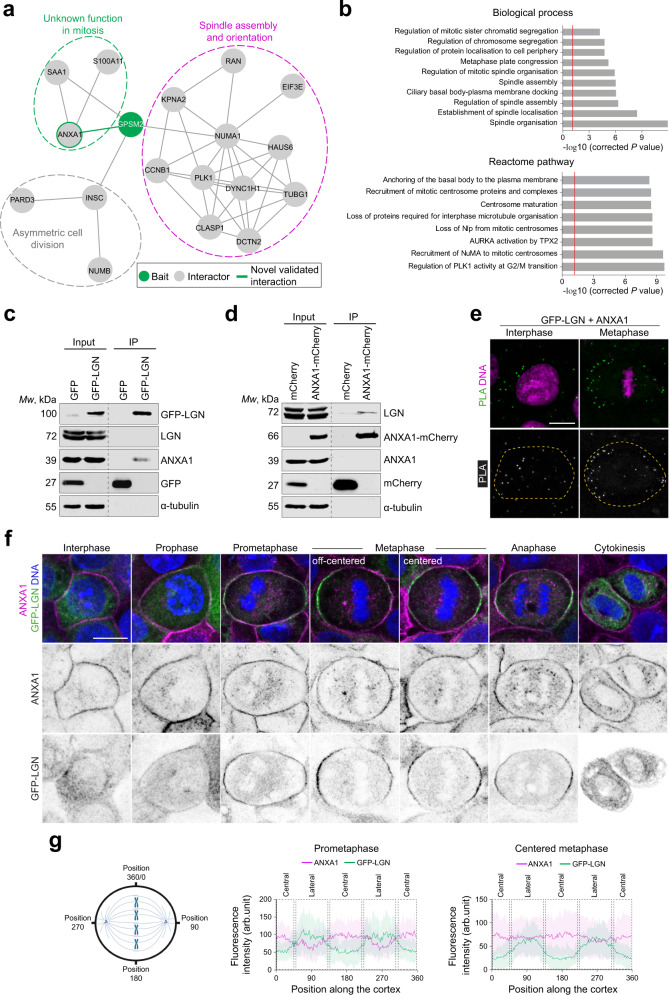
Fig. 1. ANXA1 interacts with LGN at the cell cortex during mitosis.
a Protein-protein interaction network of LGN (GPSM2, green) showing several interactors (grey) of known and unknown mitotic functions. The green line highlights a novel interaction between LGN and ANXA1, which is further validated in this study. b Gene Ontology analysis of the LGN network presenting terms from Biological process (top) and Reactome pathway analysis (bottom) significantly enriched. P-values were derived from the hypergeometric test (two-sided Fisher’s Exact Test) with Bonferroni step-down correction from multiple tests. c ANXA1 and GFP-LGN co-immunoprecipitate from MCF-10A stably expressing GFP-LGN, arrested in metaphase. Lysates were subjected to affinity purification with GFP-Trap beads. The immunoprecipitates (IP) were analysed by western blotting (3 independent experiments). d LGN and ANXA1-mCherry co-immunoprecipitate from clonal MCF-10A cells stably expressing ANXA1-mCherry, arrested in metaphase. Lysates were subjected to affinity purification with RFP-Trap beads. The immunoprecipitates were analysed by western blotting (3 independent experiments). e Proximity ligation assay (PLA) performed using GFP and ANXA1 antibodies in GFP-LGN-expressing MCF-10A cells. Cells were counterstained with DAPI (DNA, magenta) (3 independent experiments). Yellow dotted lines indicate the cell contour. f Confocal images of representative MCF-10A cells stably expressing GFP-LGN (green) stained for ANXA1 (magenta) and counterstained with DAPI (DNA, blue) (3 independent experiments). g Average cortical fluorescence intensity profiles of GFP-LGN and ANXA1 in prometaphase cells (left) and metaphase cells (right) (3 independent experiments, prometaphase n = 33 cells; metaphase n = 36 cells). Data are presented as mean ± s.e.m. Positions along the cortex in the graphs correspond to coordinates as illustrated in the schematic. arb. units (arbitrary units). All scale bars, 10 µm. Source data are provided as a Source Data file.

