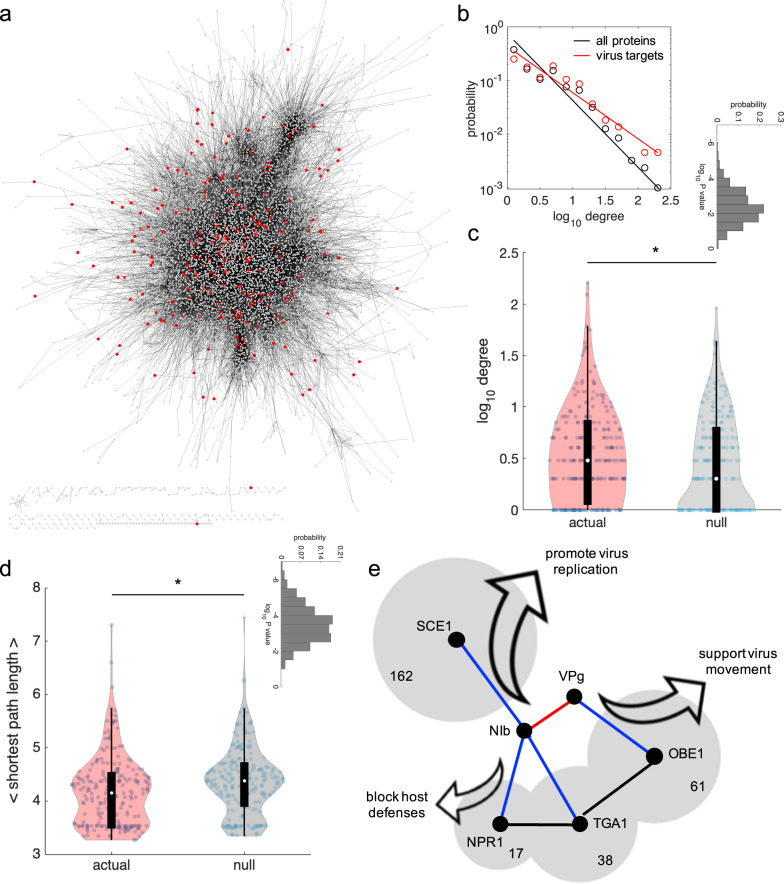
Fig. 5. The plant virus TuMV targets host proteins with higher connectivity.
a Whole PPI of the host plant A. thaliana (AI-1MAIN) contextualizing those proteins that interact with the plant virus TuMV (red nodes). b Probability distribution of the degree for only the virus targets (red) or all proteins in the host interactome (black). Points correspond to the data, whilst lines to the best-fitting power law probability ~ degree–γ (γ = 0.860 for virus targets, γ = 1.247 for all proteins). c Comparison between the actual degree distribution (from virus targets) and a representative null distribution (from randomly picked genes). *Statistical significance (Mann–Whitney U test, P < 0.05). The inset shows the distribution of P values after 1000 random realizations, with geometric mean 0.0045. d Comparison between the actual shortest path length distribution (from virus targets) and a representative null distribution (from randomly picked genes). Supplementary Fig. 3 shows the same analyses in panels b–d but excluding the 18 interactors gathered from the literature. *Statistical significance (Mann–Whitney U test, P < 0.05). The inset shows the distribution of P values after 1000 random realizations, with geometric mean 0.0003. e Network-function detail of four virus targets with markedly high degree, which interact with TuMV proteins NIb and VPg. The area of the shadow regions is log-proportional to the degree (indicated in number). TGA1 shares interactors with NPR1 and OBE1.

