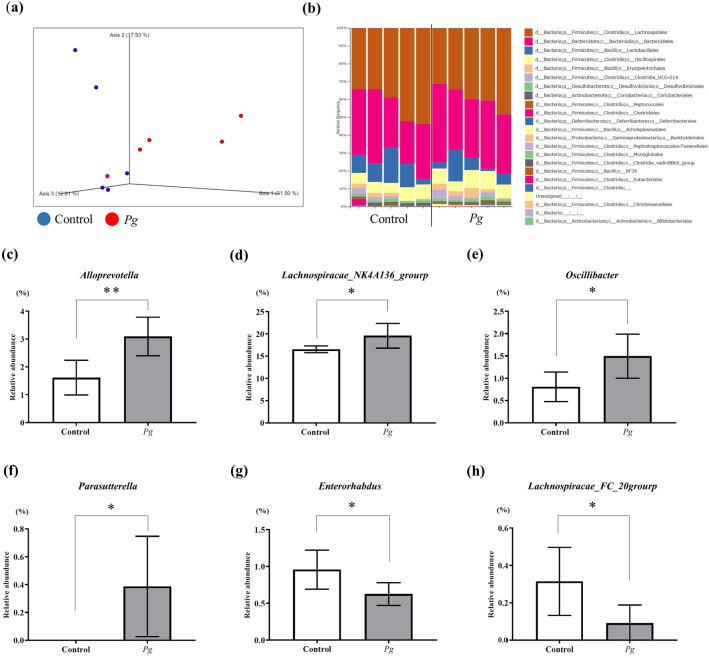
Figure 2.
Analysis of the microbiota in both groups. (a) Unweighted UniFrac distances between the groups (red: Pg; green: control). (b) Taxonomic bar plots at the order level for both groups. (c–h) There was a significant change in the relative abundance of six genera between groups (four genera increased, and two genera decreased). (c) Alloprevotella, (d) Lachnospiracae_NK4A136_group, (e) Oscillibacter, (f) Parasutterella, (g) Enterorhabdus, (h) Lachnospiracae_FCS020_group. Each group: n = 5. *p < 0.05, ** p < 0.005.

