
Figure 8. Disease- and sex-specific differences in abundance of proteins related to proteostasis.
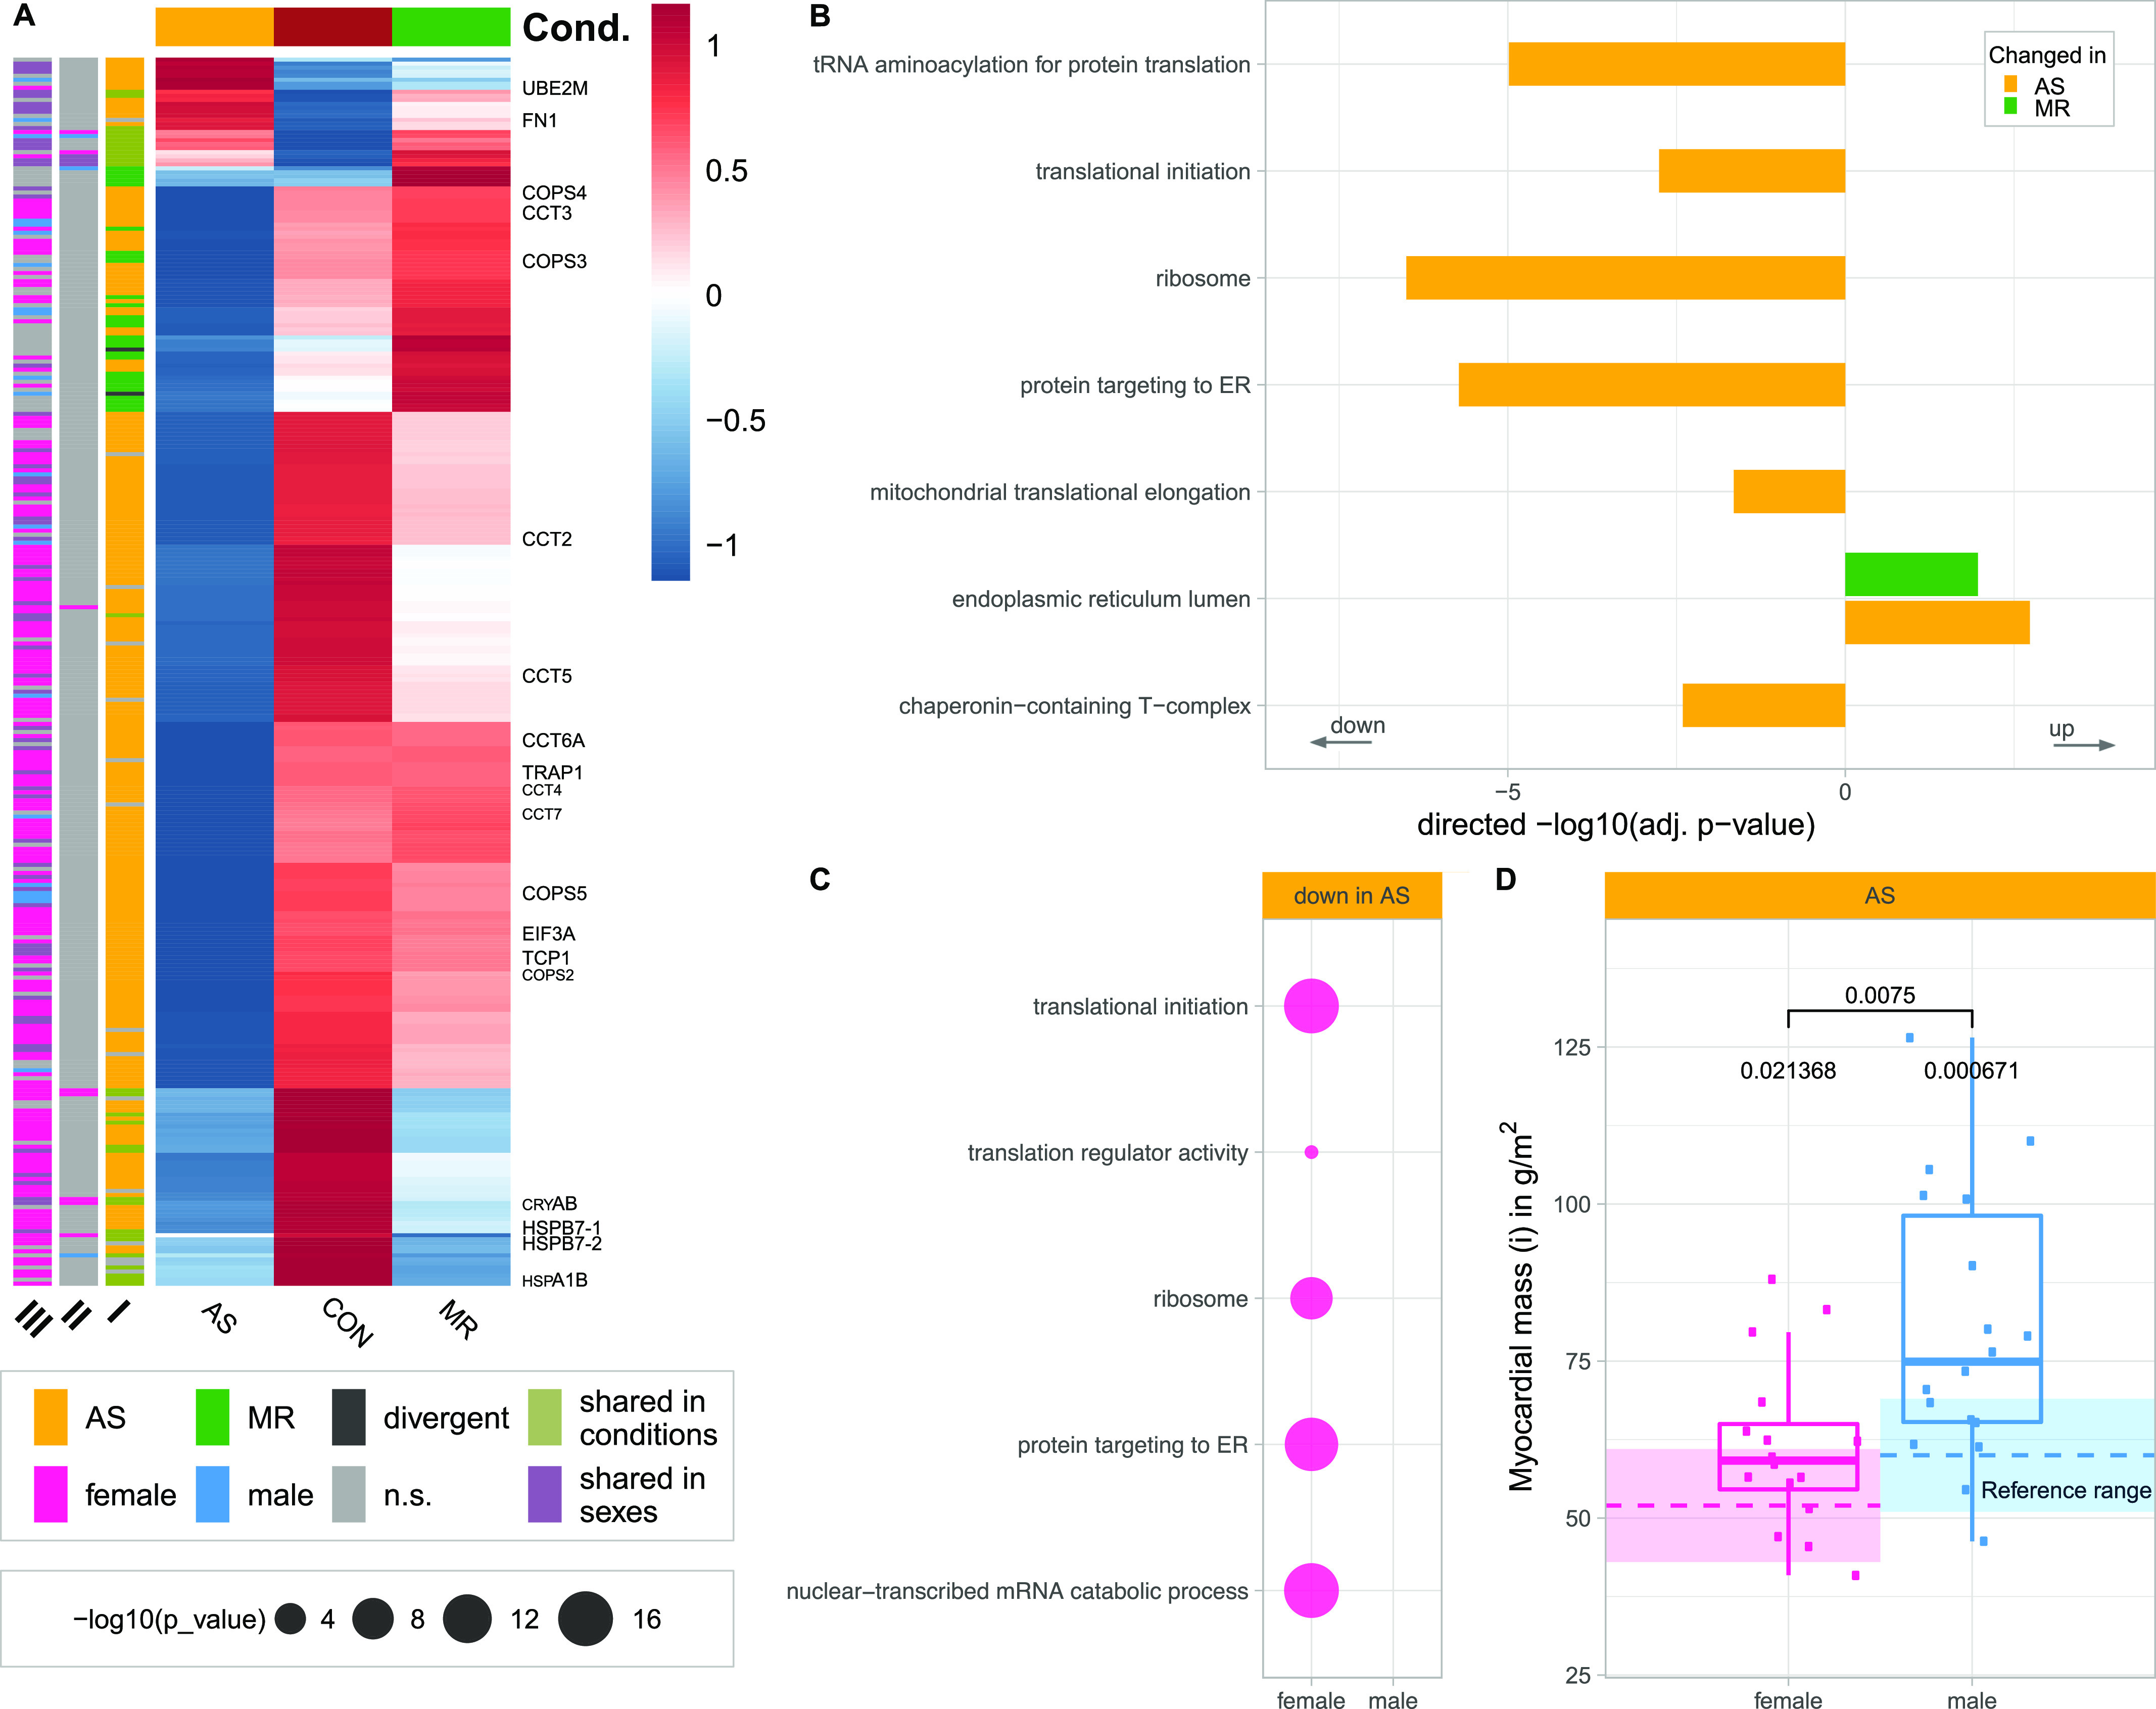
(A) Clustered heatmap showing the condition’s mean abundance of proteins belonging to proteostasis-related GO terms. Annotation bars denote significant changes in condition (I) and in sex (II—effect in sex MR; III—effect in sex AS). Proteins described in the text are labeled. (B, C) Combined results of GO term enrichment analysis in AS and MR versus CON shown in the direction of regulation they were found in (B) and on proteins found only in one sex of a condition (C). (D) Comparison of indexed myocardial mass as measured by MRI in AS stratified by sex. P-values are calculated using a Wilcoxon rank test with two samples (female versus male, denoted by brackets) and one sample against the reference mean (no bracket). AS, aortic valve stenosis; CON, healthy control hearts; Cond., condition; MR, mitral valve regurgitation; n.s., not significant.