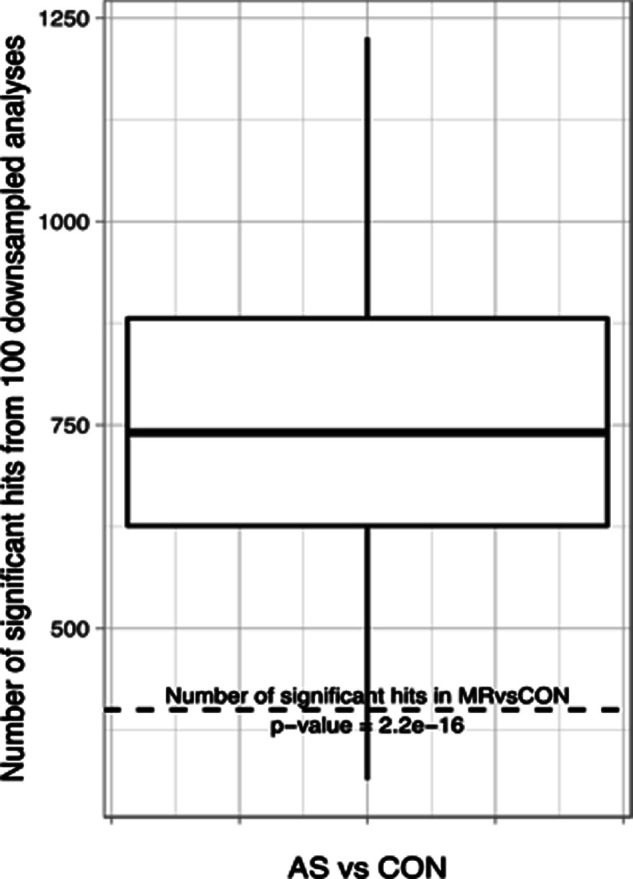
Figure S13. Additional analysis to study the possible influence of the number of individuals per group.

Down-sampling analysis was performed to study the possible influence of the number of individuals per group. For this, we randomly selected 17 samples from the AS cohort and compared them with all 17 control samples and counted total differentially abundant proteins. This was repeated 100 times, and the average number of differentially abundant proteins is 746 and as such less than in our full analysis (>1,300). However, this is still approximately twice as many as in the MR versus CON comparison where group sizes are identical (400 differentially expressed proteins). A two-sided t test against 400 resulted in a P-value of 2.2 × 10⁻¹⁶. We can thus conclude that the higher number is not an exclusive effect of higher power; instead, there is much more regulation even when equal sample sizes are considered.
