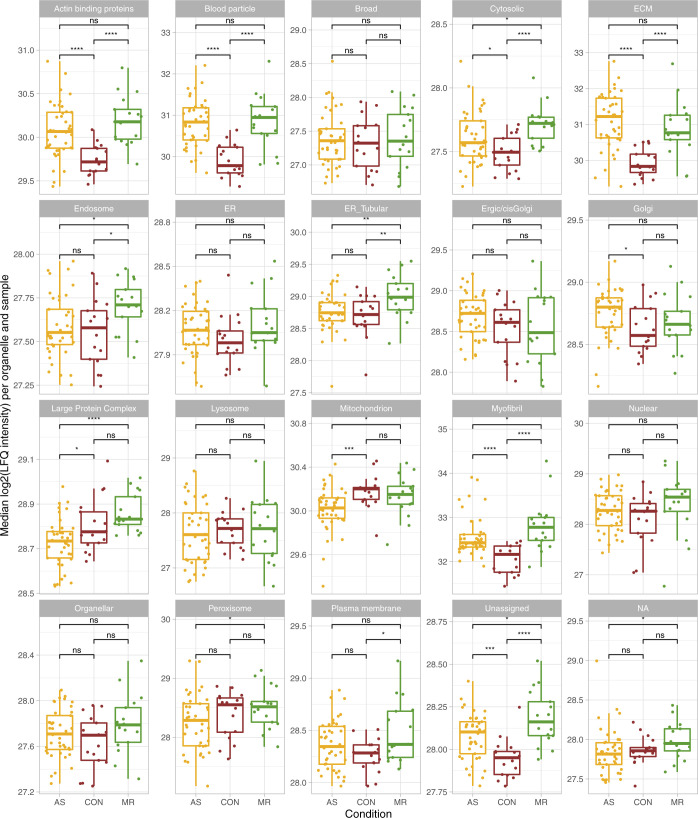
Figure S14. Proteins belonging to different organelles.
Median log2 of LFQ intensity of proteins belonging to the different organelles as assigned by Doll et al (2017) for AS (yellow), CON (brown), and MR (green). P-values for condition group comparisons are calculated using a Wilcoxon rank test. AS, aortic valve stenosis; CON, healthy control hearts; MR, mitral valve regurgitation.

