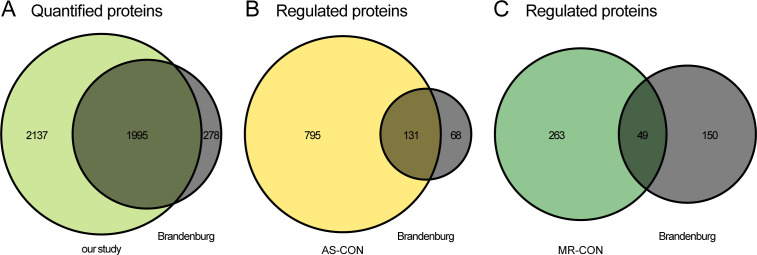
Figure S2. Comparison of protein quantification.
(A, B, C) Comparison of our study with Brandenburg et al in terms of quantified proteins (A) and significantly different proteins between control and AS (B) and MR (C) versus Brandenburg (NF versus NEFHG and LEFHG and LEFLG and PLFLG) based on a ComBat-corrected joint linear model analysis. (B, C) Fisher’s exact test for association between (B) AS-CON and Brandenburg, P = 8.6 × 10⁻⁹ and (C) MR-CON and Brandenburg, P = 4.5 × 10⁻⁴. Statistical information concerning Fig S2: protein quantifications and sample annotations of the Brandenburg et al study were retrieved from the associated PRIDE submission https://www.ebi.ac.uk/pride/archive/projects/PXD019594 file 20190503_S_Brandenburg ID and Quantitation Results.xlsx. Missing values were imputed as for our dataset. Proteins were mapped based on UniProt Accession number (matching the first entry in case of multiple UniProt Accession numbers in a protein group), without valid value filter in our study, but only proteins quantified in both datasets were kept. To obtain compatible data, batch correction via ComBat (Johnson et al, 2007; PMID: 16632515) using the sva R package (v. 3.38.0) and setting our data as reference batch was applied. Linear models for this comparison analysis were calculated using the combined batch correct data using the empirical Bayes procedures for residual variance estimation and mean–variance trend correction from limma (v. 3.46.0). Contrasts to retrieve differential abundance were stated as follows: AS versus CON, MR versus CON for our study, and NEFHG and LEFHG and LEFLG and PLFLG versus NF for Brandenburg data. P-values are multiple testing corrected by the Benjamini–Hochberg methodology, and a significance cutoff of 0.05 was applied for determining overlaps. Venn diagrams were created using the VennDiagram R package (v. 1.6.20).

