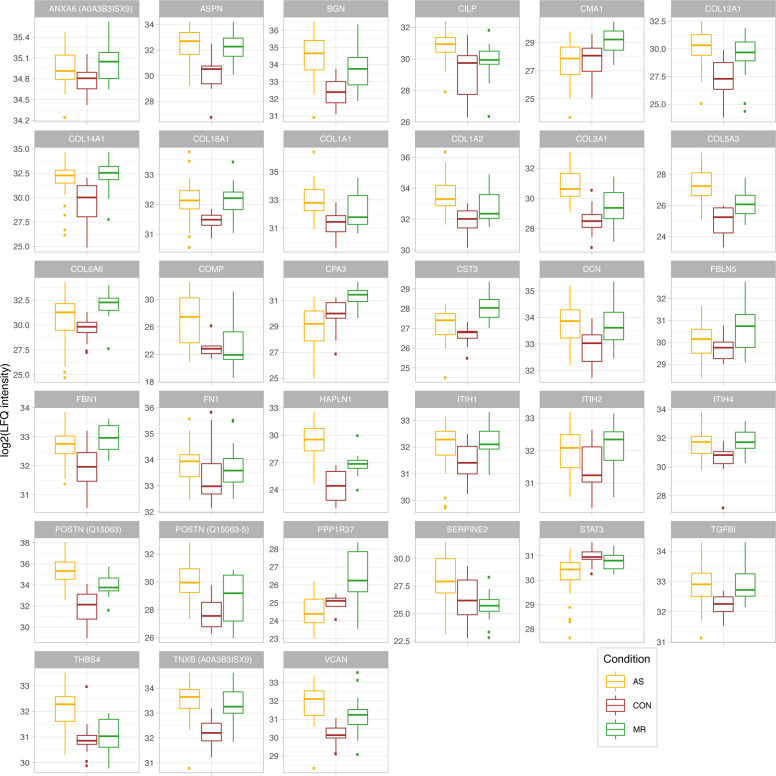
Figure S3. Proteins belonging to ECM.
Log2-transformed LFQ intensity for selected proteins belonging to the ECM. All proteins shown are mentioned in the main text and are significant in at least one comparison. In case of ambiguous gene symbols, the majority protein ID is shown in brackets. Full protein IDs and P-values for all comparisons are given in Table S1. AS, aortic valve stenosis; CON, healthy control hearts; MR, mitral valve regurgitation.

