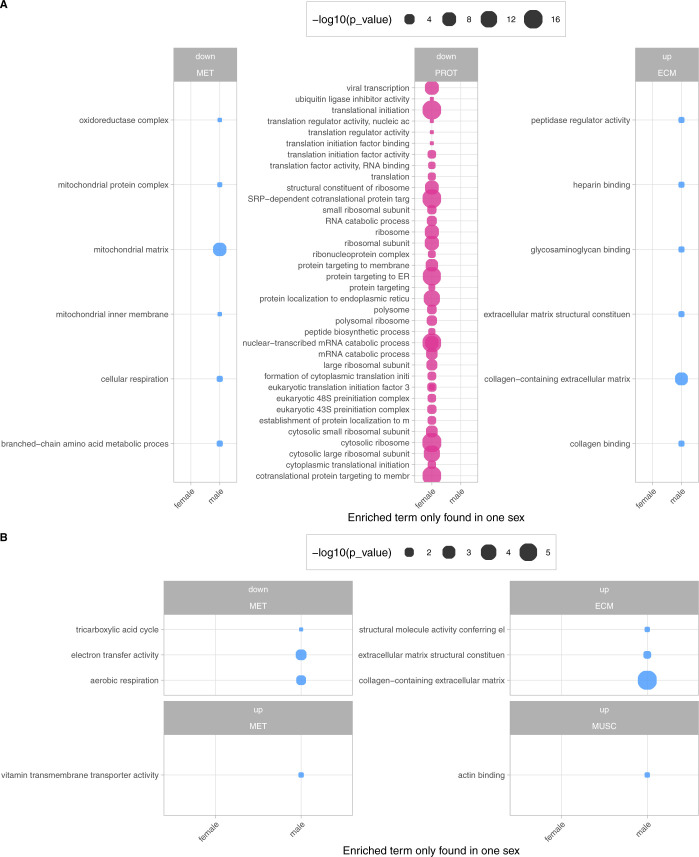
Figure S4. Full GO term enrichment results of the sex-stratified analysis.
(A, B) Combined results of GO term enrichment analysis of proteins found to be differentially expressed in only one sex (female = pink; male = blue) in AS (A) and MR (B). The negative log10-transformed P-value is encoded by circle-size plots that are subdivided to show the direction of the change in protein expression (up, down) and the respective category assignments. False discovery rate in the gprofiler2 analysis was set to 5%.

