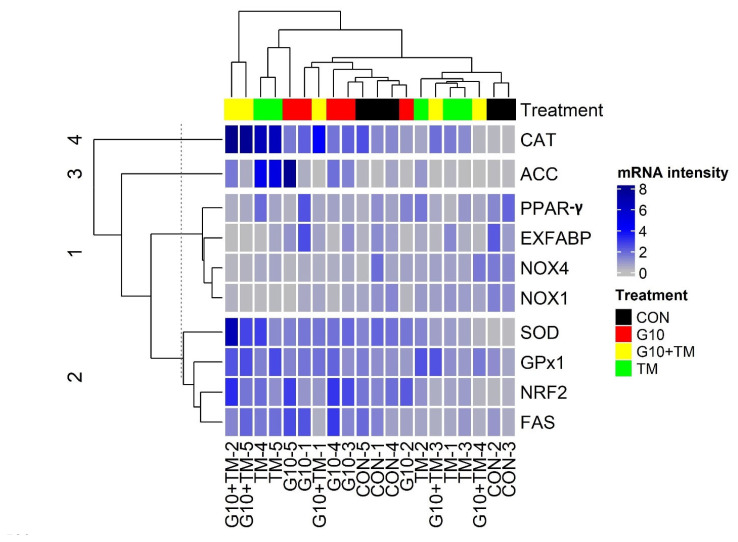
Figure 1.
Hierarchical cluster tree of hepatic gene expression. The genes panel included antioxidant genes (CAT, SOD, GPx1, NOX1, NOX4, and NRF2) and lipid metabolism genes (ACC, FAS, EXFABP, and PPAR-γ). Each row represents a gene and each column represents an experimental unit belonging to a specific treatment. The treatments are described as follows: CON, control eggs without in ovo injection and incubated at standard temperature; G10, eggs injected at 17.5 days of incubation with 0.6 mL of 10% γ-aminobutyric acid dissolved in distilled water; TM, thermally manipulated eggs exposed to 39.6°C for 6 h daily from embryonic day 10 to 18; G10+TM, eggs that received both previous treatments during incubation. Gene expression analysis was performed using real-time quantitative polymerase chain reaction (RT-qPCR) with GAPDH and β-actin as reference genes. The tree was constructed using the package “ComplexHeatmap” of the R software version 4.0.3 (R Core Team, 2020). CAT, catalase; ACC, acetyl-CoA carboxylase; PPAR-γ, peroxisome proliferator-activated receptor-gamma; EXFABP, extracellular fatty acid-binding protein; NOX4, nicotinamide adenine dinucleotide phosphate oxidase 4; NOX1, nicotinamide adenine dinucleotide phosphate oxidase 1; SOD, superoxide dismutase; GPx1, glutathione peroxidase 1; NRF2, nuclear factor erythroid 2-related factor 2; FAS, fatty acid synthase.

