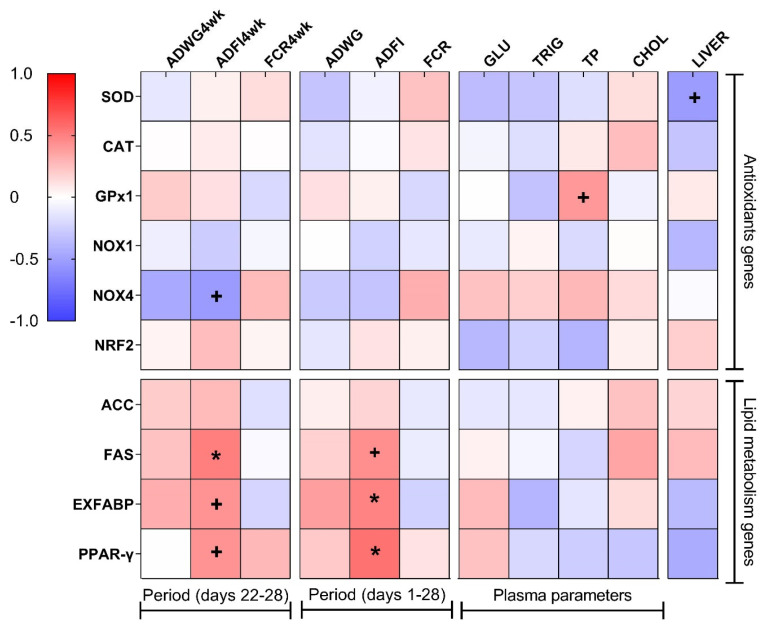
Figure 2.
Pearson correlation heat map between the relative mRNA levels of the genes studied, the growth parameters, the plasma biochemical parameters, and the relative liver weight in broiler chickens. The red color indicates a positive correlation, the blue color indicates a negative correlation and the white color indicates no correlation. Pearson r values were calculated using the “CORR procedure” of the SAS software version 9.4 (SAS Institute Inc., 2009). ADWG4wk, average daily weight gain of the last week; ADFI4wk, average daily feed intake of the last week; FCR4wk, feed conversion ratio of the last week; ADWG, average daily weight gain; ADFI, average daily feed intake; FCR, feed conversion ratio; GLU, glucose; TRIG, triglycerides; TP, total protein; CHOL, cholesterol; LIVER, relative liver weight; SOD, superoxide dismutase; CAT, catalase; GPx1, glutathione peroxidase 1; NOX1, nicotinamide adenine dinucleotide phosphate oxidase 1; NOX4, nicotinamide adenine dinucleotide phosphate oxidase 4; NRF2, nuclear factor erythroid 2-related factor 2; ACC, acetyl-CoA carboxylase; FAS, fatty acid synthase; EXFABP, extracellular fatty acid-binding protein; PPAR-γ, peroxisome proliferator-activated receptor-gamma. + Indicates a trend at the 0.1 level. * Correlation is significant at p<0.05 level.

