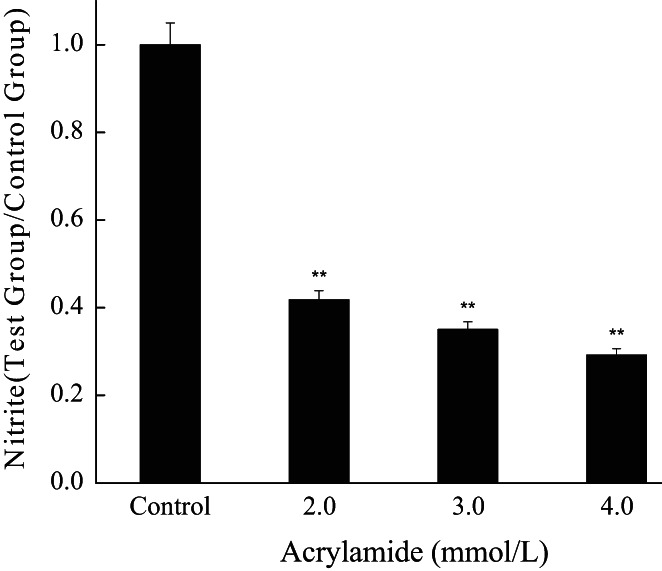
FIGURE 7.

The influence of acrylamide on nitric oxide (NO) production. Cells were treated with different concentrations of acrylamide for 24 h, and then the level of NO was analyzed by colorimetric assay. *p < .05 and **p < .01 vs. control, #p < .05

The influence of acrylamide on nitric oxide (NO) production. Cells were treated with different concentrations of acrylamide for 24 h, and then the level of NO was analyzed by colorimetric assay. *p < .05 and **p < .01 vs. control, #p < .05