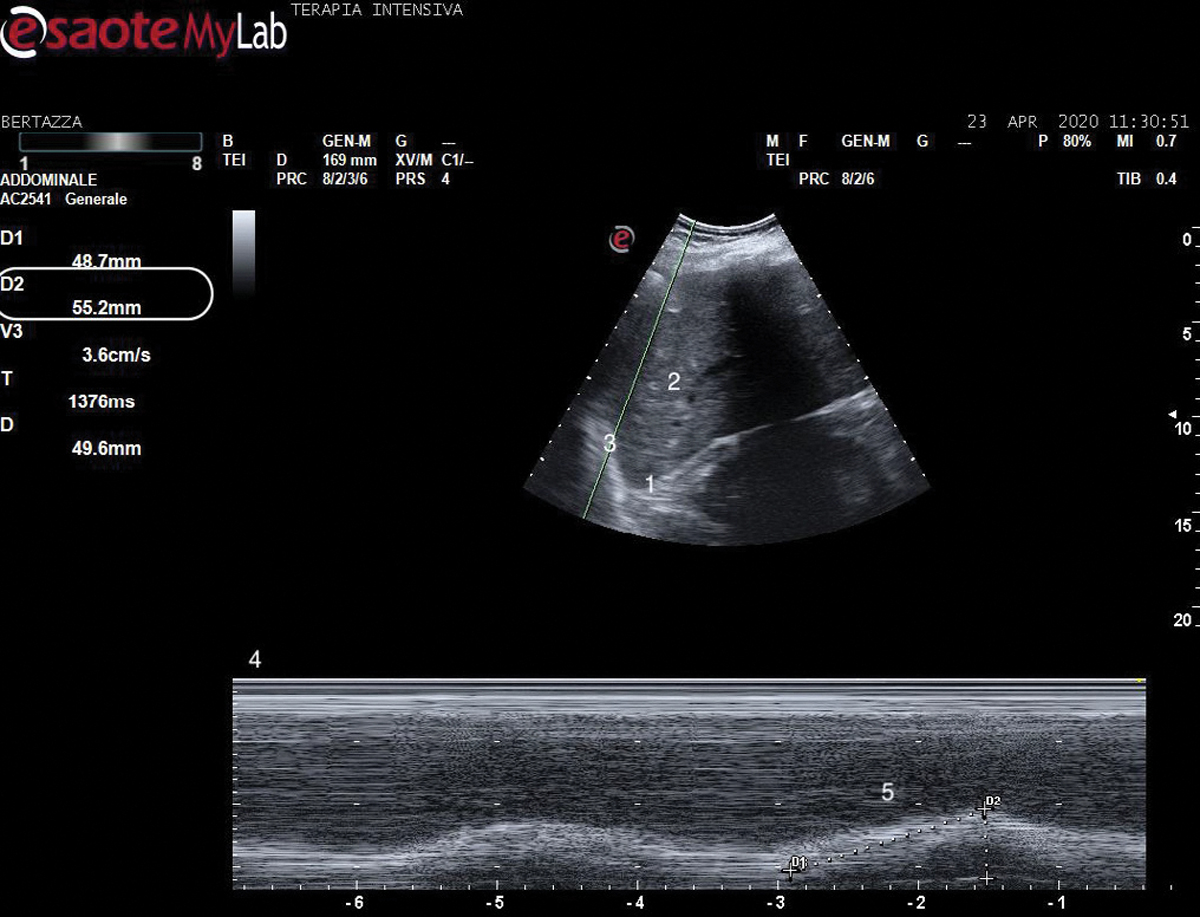
Figure 2:

US study, B-mode shows the diaphragm (1) next to the liver (2). Identification of a point of the diaphragm (3), of which the kinetics is studied in the figure below (4). The space has been measured (on the left) and identified in the figure (5). where we can see the time on the x-axis.
