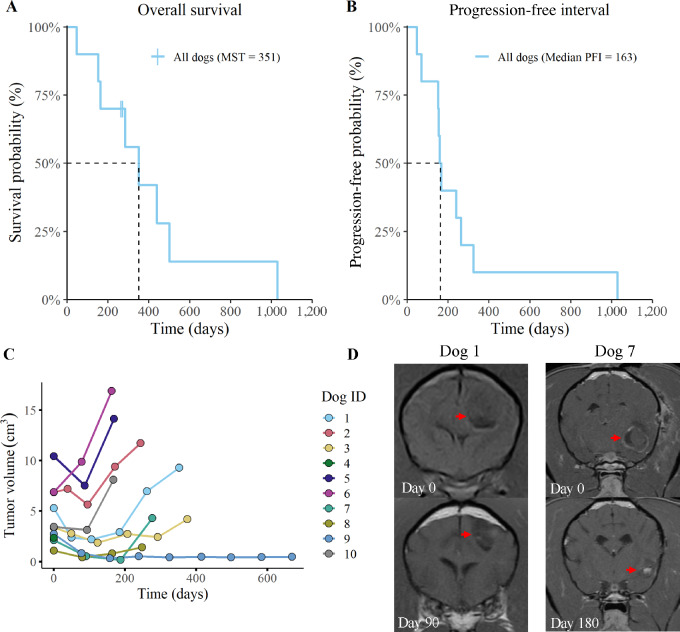
FIGURE 2.
Overall survival and PFI curves for all enrolled dogs. Overall survival (A) and PFI (B) curves for all 10 dogs are depicted. Two dogs were censored from the overall survival data following deviation from the treatment protocol (time of censorship is noted with a vertical hash mark). Plot (C) represents tumor volume measurements, as determined by MRI. Tumor volume was evaluated every 3 months and volume was determined using transverse plane post-contrast T1-weighted images. Measurements were recorded until death or withdrawal from study. Images (D) are representative of changes in tumor volume for one dog with stable disease (dog 1) and one dog with partial tumor regression (dog 7).

