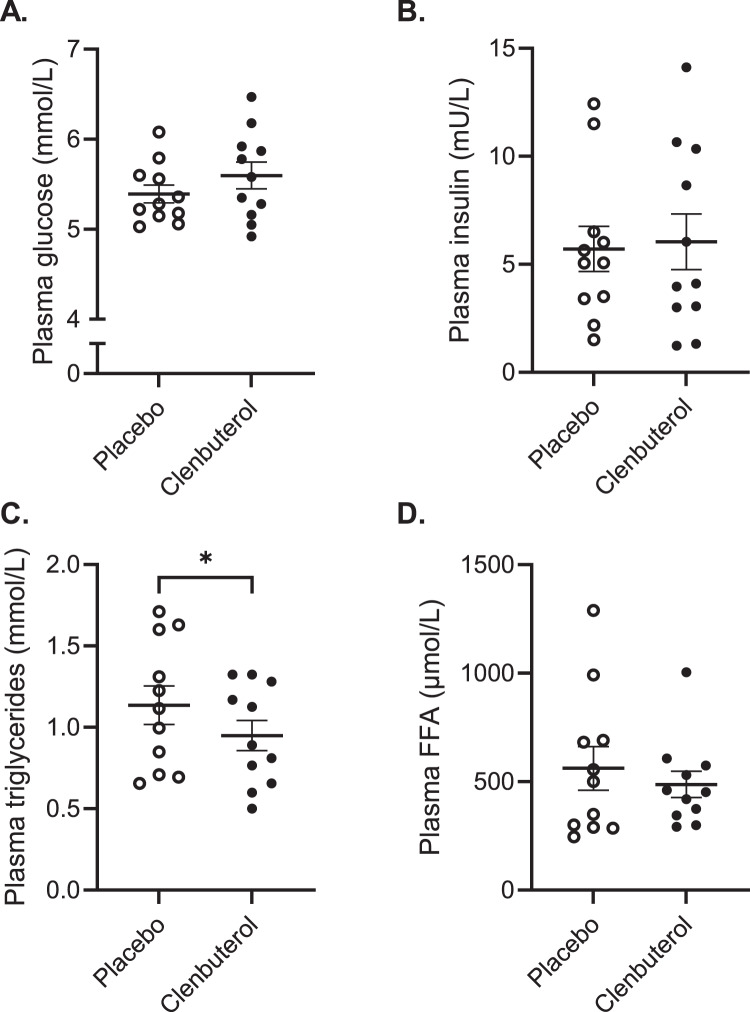
Fig. 6. The effect of prolonged clenbuterol treatment on fasting plasma substrate concentrations.
A Plasma glucose concentrations (mmol/L). B Plasma insulin concentrations (mU/L). C Plasma triglyceride concentrations (mmol/L) (p = 0.02). D Plasma free fatty acid concentrations (µmol/L). FFA free fatty acid. All data were analyzed by means of a two-sided Wilcoxon signed-rank test. Clenbuterol: n = 11, Placebo: n = 11. *p < 0.05. Data are presented as mean ± SEM. Source data are provided as a Source Data file.

