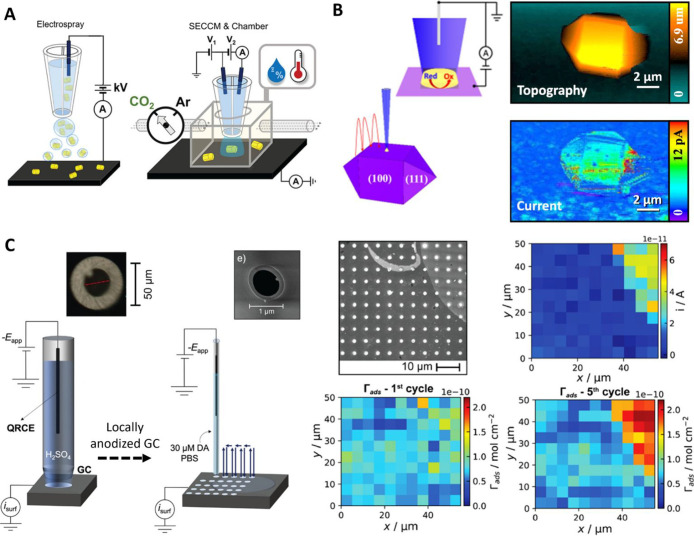
Figure 6.
(A) Schematic of the pipet electrospray method for Au nanocrystal deposition; and the subsequent characterization of electrochemical CO2 reduction reaction, at individual nanocrystals, under a controlled environment. Reproduced from Jeong, S.; Choi, M. H.; Jagdale, G. S.; Zhong, Y.; Siepser, N. P.; Wang, Y.; Zhan, X.; Baker, L. A.; Ye, X. J. Am. Chem. Soc. 2022, 144 (28), 12673–12680 (ref (208)). Copyright 2022 American Chemical Society. (B) Left: Illustration of SECCM mapping at a H-BDD single particle. Right: SECCM topography and current image, of a H-BDD single particle with the (100) face orientated upward, during Fe(CN)64– oxidation. Reproduced from Ando, T.; Asai, K.; Macpherson, J.; Einaga, Y.; Fukuma, T.; Takahashi, Y. Anal. Chem.2021, 93 (14), 5831–5838 (ref (247)). Copyright 2021 American Chemical Society. (C) Left: Schematics of the SECCM device for local modification (anodization in H2SO4 solution) and to map the modified surface activity (with respect to DA electro-oxidation). Optical and SEM images of the respective pipet apertures are shown over the schematics. Right: SEM image of the SECCM scan area covering pristine (darker) and anodized (brighter) regions of the GC electrode; along with analysis of the spatially resolved voltammetric characteristics. Map of the current, i, obtained at the DA oxidation peak potential which shows that electroactivity is correlated to DA surface concentration (Γads) (first and fifth voltammetric cycle presented, respectively). Reproduced from Swinya, D. L.; Martin-Yerga, D.; Walker, M.; Unwin, P. R. J. Phys. Chem. C2022, 126 (31), 13399–13408 (ref (249)) under CC BY 4.0 license.

