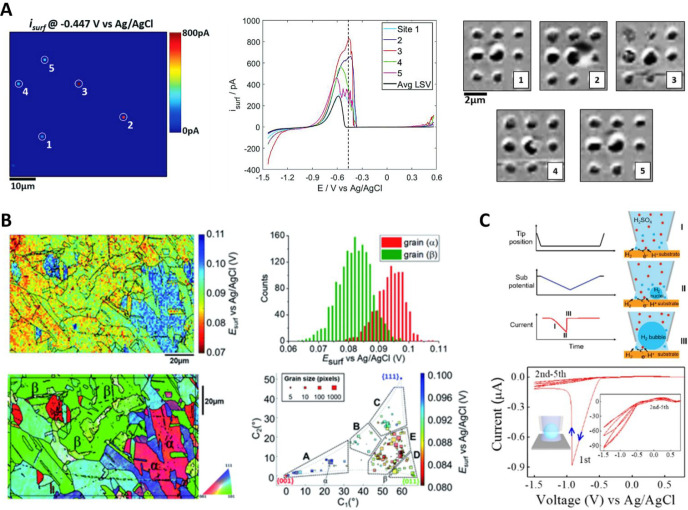
Figure 7.
(A) Left and center: SECCM current map, at a WE potential of −0.447 V vs Ag/AgCl QRCE, obtained from 3600 localized voltammetry measurements of Fe dissolution; and i–E curves (scan rate = 2 V s–1) of the 5 highly active pixels labeled, versus the average response (black trace). The image in panel A is a snapshot at the potential indicated by the vertical dashed line. Right: electron microscopy images, after anodic dissolution of arrays of pixels, centered at the 5 active pixels. Reprinted from Electrochim. Acta2020, Vol. 332, Yule, L. C.; Shkirskiy, V.; Aarons, J.; West, G.; Shollock, B. A.; Bentley, C. L.; Unwin, P. R. Nanoscale electrochemical visualization of grain-dependent anodic iron dissolution from low carbon steel, 135267 (ref (256)) under CC BY 4.0 license. (B) Left: snapshot of the required potential Esurf for the Cu dissolution process, measured during chronopotentiometry at 0.2s (top); with overlaid grain boundaries, taken from the colocated EBSD crystallographic orientation map (bottom). Right: statistical distribution of Esurf (top) extracted from grains α and β, of the EBSD map; and full grain orientation correlation analysis of Esurf at 0.2 s versus the average grain orientation. Reproduced from Daviddi, E.; Shkirskiy, V.; Kirkman, P. M.; Robin, M. P.; Bentley, C. L.; Unwin, P. R. Chem. Sci. 2020, 12 (8), 3055–3069 (ref (225)) under CC BY 3.0 license. (C) Visualization of bubble nucleation with SECCM. Probing the electrochemical nucleation of single H2 bubble on a Pt surface via SECCM. Top: experimental parameters and voltammetric recording; and schematic of bubble nucleation and growth within the pipet tip, while in contact with the surface. Bottom: HER voltammetry with a 30 μm radius pipet, revealing blockage by H2 gas, after the first cycle. Reproduced from Liu, Y.; Jin, C.; Liu, Y.; Ruiz, K. H.; Ren, H.; Fan, Y.; White, H. S.; Chen, Q. ACS Sens.2021, 6 (2), 355–363 (ref (267)). Copyright 2021 American Chemical Society.

