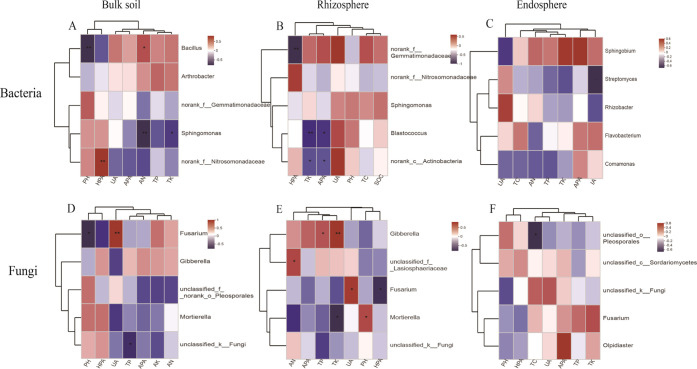
Figure 4.
Three nitrogen fertilization treatment (0 (N0), 180 (N180), and 360 (N360) kg N ha –1) correlation heatmaps showing the corn soil chemical variable in bacterial (A–C) and fungal (D–F) genus communities of a microbial classification relationship with the environmental variable, R-value, to show different colors in the picture (*P < 0.05, **P < 0.01, and ***P ≤ 0.001).

