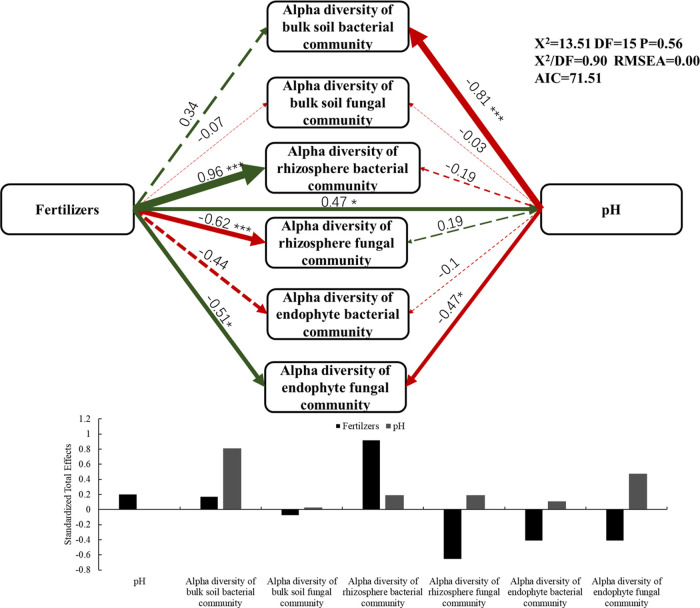
Figure 5.
Structural equation model (SEM) illustrating the direct and indirect effects of nitrogen fertilizers on pH and α-diversity of the bacterial and fungal communities of soil, rhizosphere, and endosphere. Significant and nonsignificant relationships are represented by continuous and dashed arrows, respectively. Path coefficients are the adjacent numbers in the same direction indicated by the arrow and are proportional to the degree of the width. The green arrows represent positive correlations and the red arrows represent negative correlations. Significance levels are expressed as *P < 0.05 and **P < 0.01. The standardized total effect calculated by SEM is shown in the table below the figure.

