
Fig. 5.
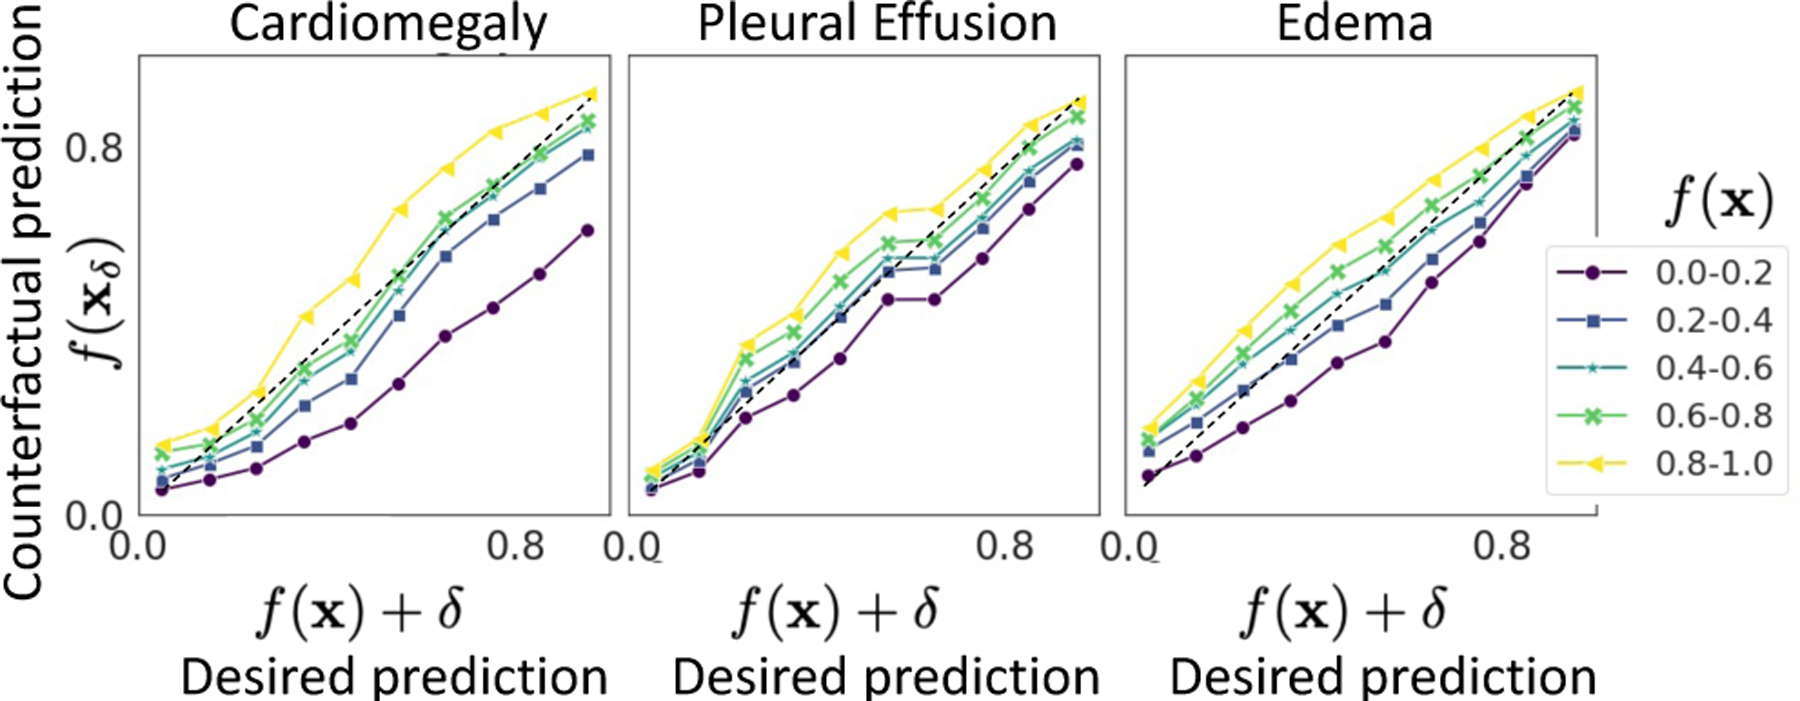
The plot of condition, c (desired prediction), against actual response of the classifier on generated explanations, f (xc). Each line represents a set of input images with prediction f (x) in a given range. Plots for xGEM and cycleGAN are shown in SM-Fig. 18.