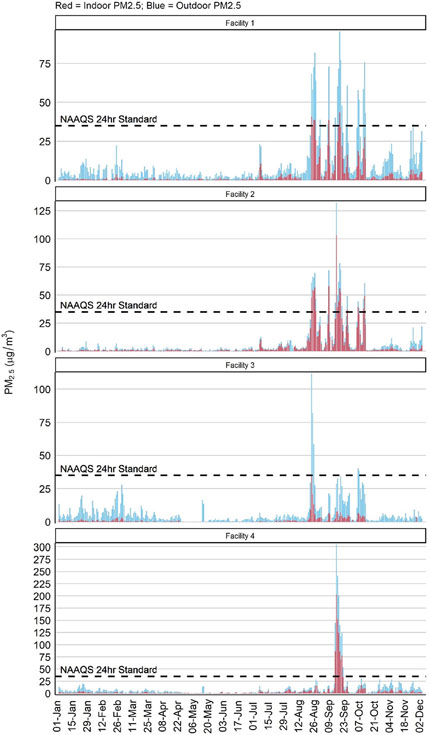
FIGURE 1.
Indoor and Outdoor PM2.5, 2020. Time-series graphs represent fine particulate data collected for four skilled nursing facilities in Idaho, USA, from January 1, 2020, through December 1, 2020, where red bars represent data from the indoor sensor, and blue bars represent the outdoor sensor. PM2.5, fine particulate matter; NAAQS, United States Environmental Protection Agency National Ambient Air Quality Standard (35 μg/m3 of PM2.5 for a 24 h period)

