
Figure 2:
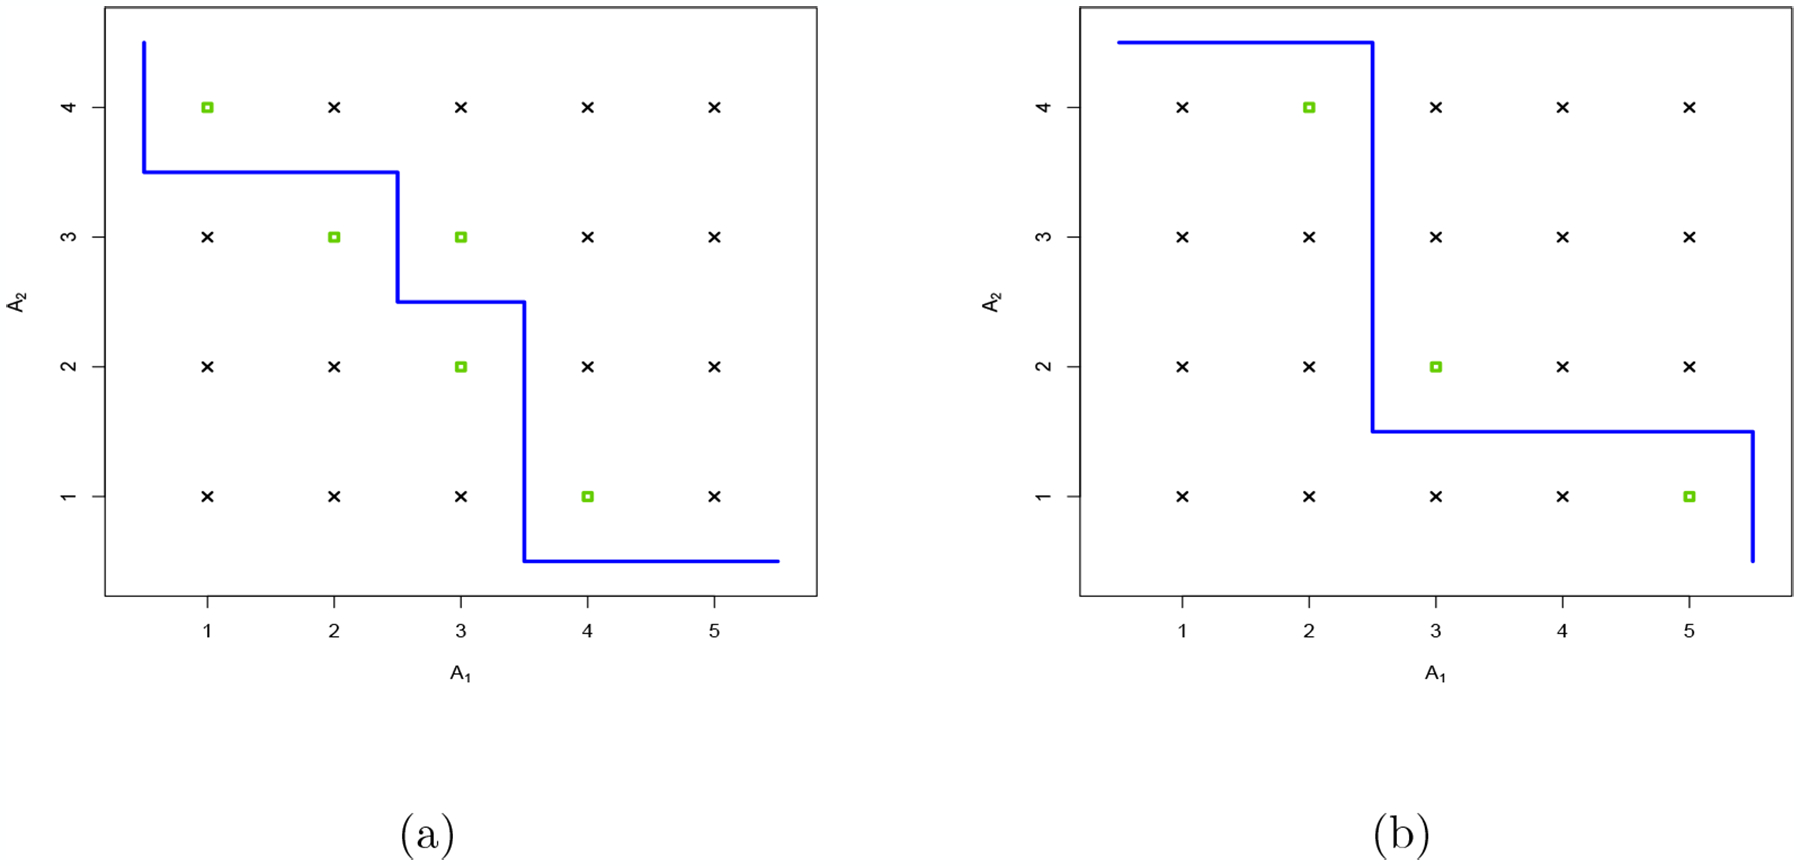
Two contours called (a) and (b): the green squares represent the dose combinations belonging to the minimal set. Contour (a) corresponds to the one of Scenario T (Table 1)
Official websites use .gov
A
.gov website belongs to an official
government organization in the United States.
Secure .gov websites use HTTPS
A lock (
) or https:// means you've safely
connected to the .gov website. Share sensitive
information only on official, secure websites.
Two contours called (a) and (b): the green squares represent the dose combinations belonging to the minimal set. Contour (a) corresponds to the one of Scenario T (Table 1)