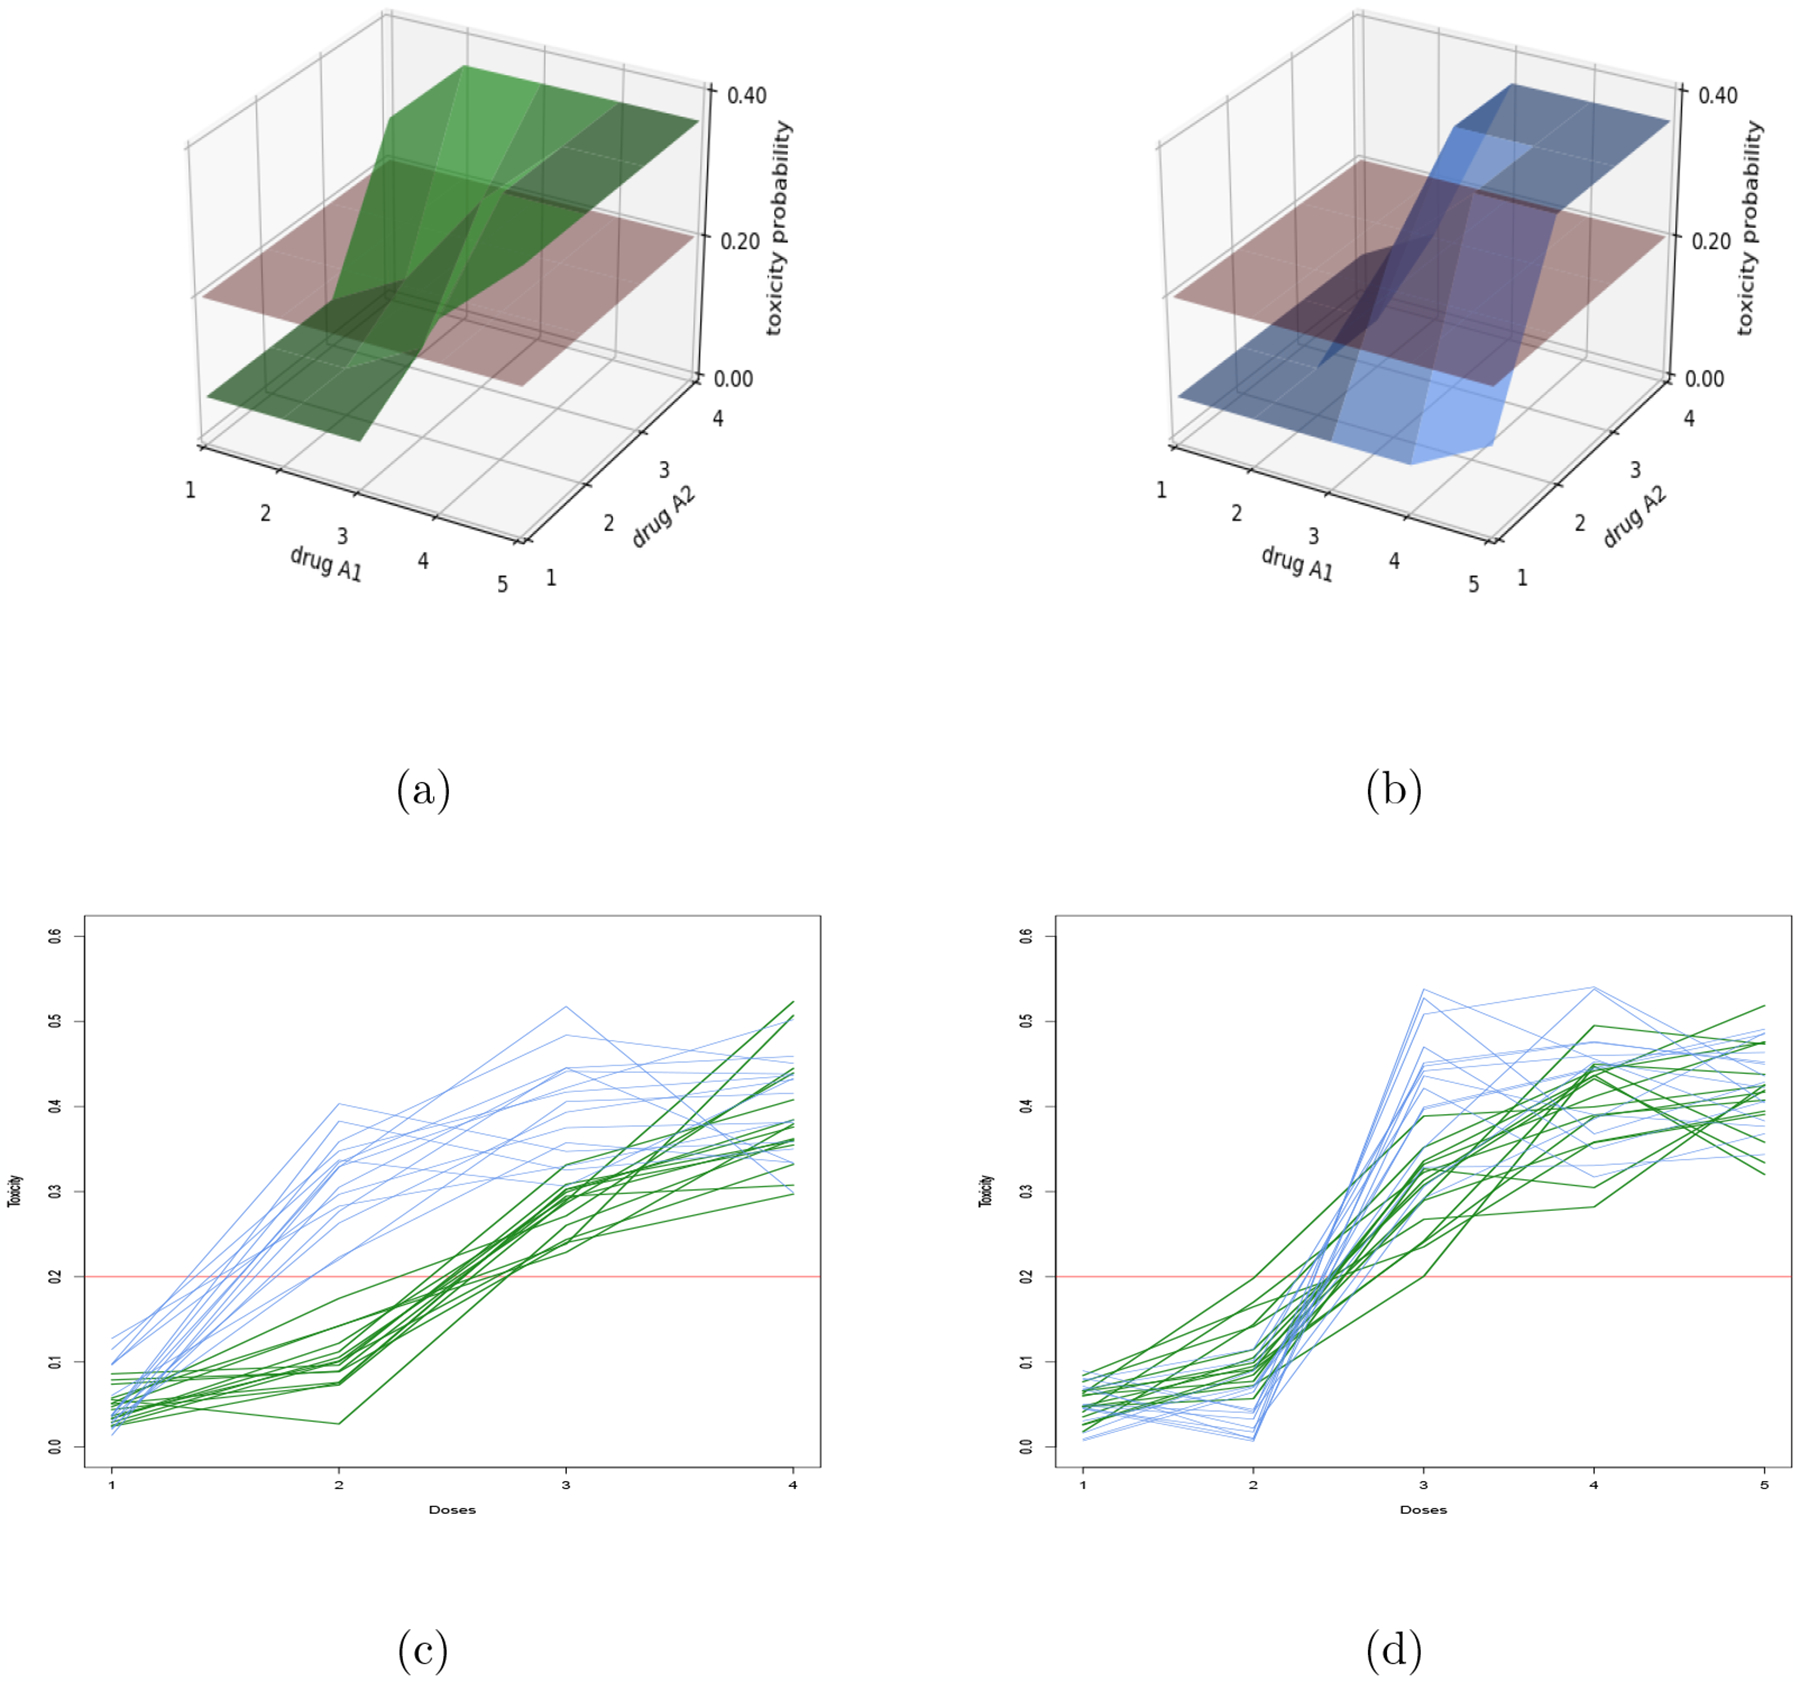
Figure 3:

Model of two competitive contours: The blue and green models corresponds to contours (a) and (b) (Figure 2). Figures (a) and (b) show the modes of and for each dose d in comparison to the target α = 0.20. Figures (c) and (d) represent sampling of marginal scenarios under these models when agent A1 (respectively A2) is fixed at dose level 3.
