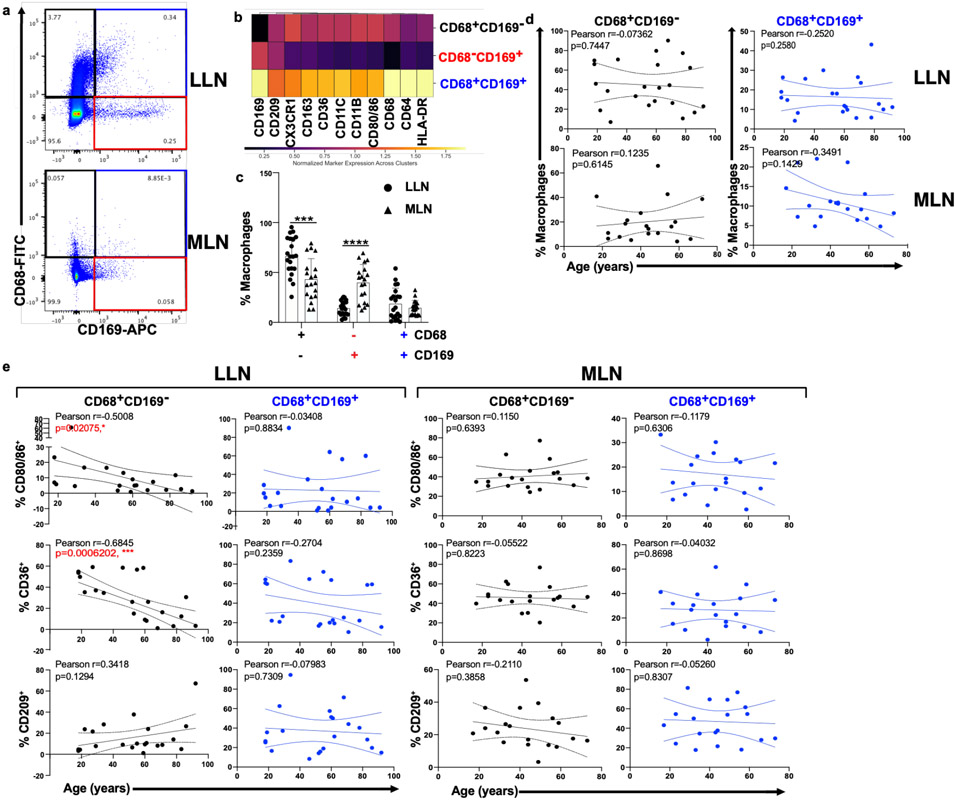
Fig. 3. Particulate-containing CD68+CD169− macrophages are increased in LLN and exhibit declining function over age.
a. Expression of CD68 and CD169 gated on live, singlet, and CD45+CD3−cells showing CD68+CD169− (black rectangle), CD68-CD169+ (red rectangle), and CD68+CD169+ (blue rectangle) macrophage subsets. b. Differential expression of indicated markers by the three macrophages subsets compiled from LLN shown in a heat map. c. Frequency of macrophage subsets in LLN (n=21) and MLN (n=19). Mixed effects analysis with Tukey’s posttest. Data presented as the mean ± SD. Significance for CD68+CD169− LLN vs. MLN: P=0.0004, CD68−CD169+ LLN vs. MLN: P=<0.0001, CD68+CD169+ LLN vs. MLN: P=0.9458. d. Frequency of macrophage subsets in LLN (n=21) and MLN (n=19) over age. Linear regression with Pearson correlation (two-tailed). Significance for LLN: CD68+CD169− P=0.7447, CD68+CD169+ P=0.2580; MLN: CD68+CD169− P=0.6145, CD68+CD169+ P=0.1429. Pearson r, *P < 0.033, **P < 0.005 and ***P < 0.001. Data presented as the mean ± 95% CI e. Expression of functional markers CD80/86, CD36, and CD209 by LN CD68+CD169− (first and third column) and CD68+CD169+ (second and fourth column) macrophage subsets in LLNs (n=22, first and second column) and MLNs (n=21, third and fourth columns) over age. Linear regression with Pearson correlation (two-tailed). Significance for LLN: CD68+CD169− of % CD80/86+ P=0.02075, CD68+CD169− of % CD36+ P=0.0006202, CD68+CD169− of % CD209+ P=0.1294, CD68+CD169+ of % CD80/86+ P=0.8834, CD68+CD169+ of % CD36+ P=0.2359, CD68+CD169+ of % CD209+ P=0.7309; MLN: CD68+CD169− of % CD80/86+ P=0.6393, CD68+CD169− of % CD36+ P=0.8223, CD68+CD169− of % CD209+ P=0.3858, CD68+CD169+ of % CD80/86+ P=0.6306, CD68+CD169+ of % CD36+ P=0.8698, CD68+CD169+ of % CD209+ P=0.8307. Pearson r, *P < 0.033, **P < 0.005 and ***P < 0.001. Data presented as the mean ± 95% CI.

