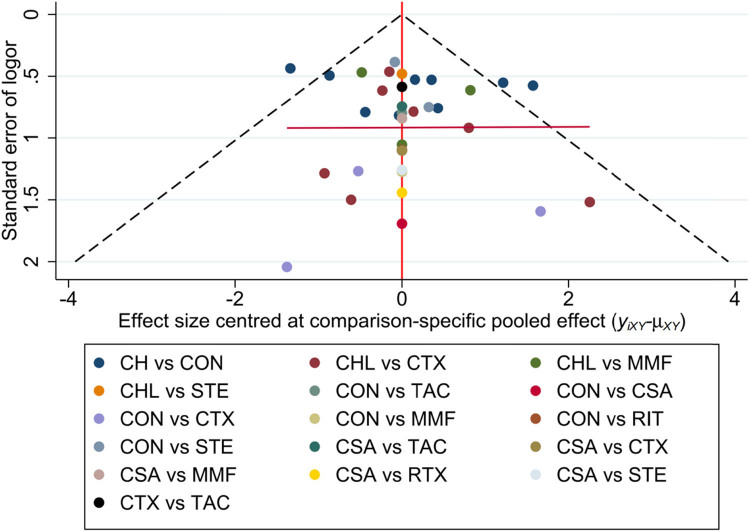
Figure 5.
Funnel plot for CR, with a complex evidence network including 16 sets of head-to-head randomized trials as shown above. Single markers represented the individual primary studies, while the orange vertical line showed the summary effect estimate, and the dashed oblique lines showed the 95% CIs at varying degrees of precision.

