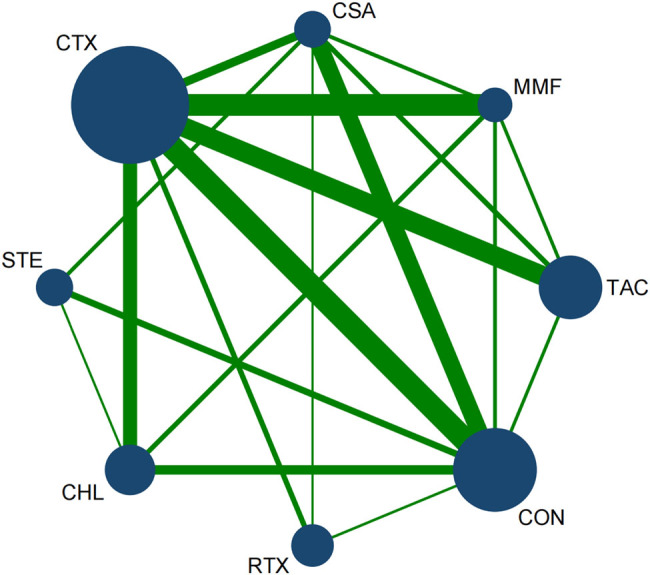
Figure 7.

Network diagram for TR: The network of all treatments used for the evaluation of TR. The node size was found to be proportional to the number of patients who were randomized for each modality and the line thickness was corresponded to the number of direct comparisons. For example, the size of the CTX circle was the largest, while the line between CTX and CON was the thickest. This indicates that that CTX had the greatest number of studies, and direct comparisons between CTX and CON were commonly found in the literature.
