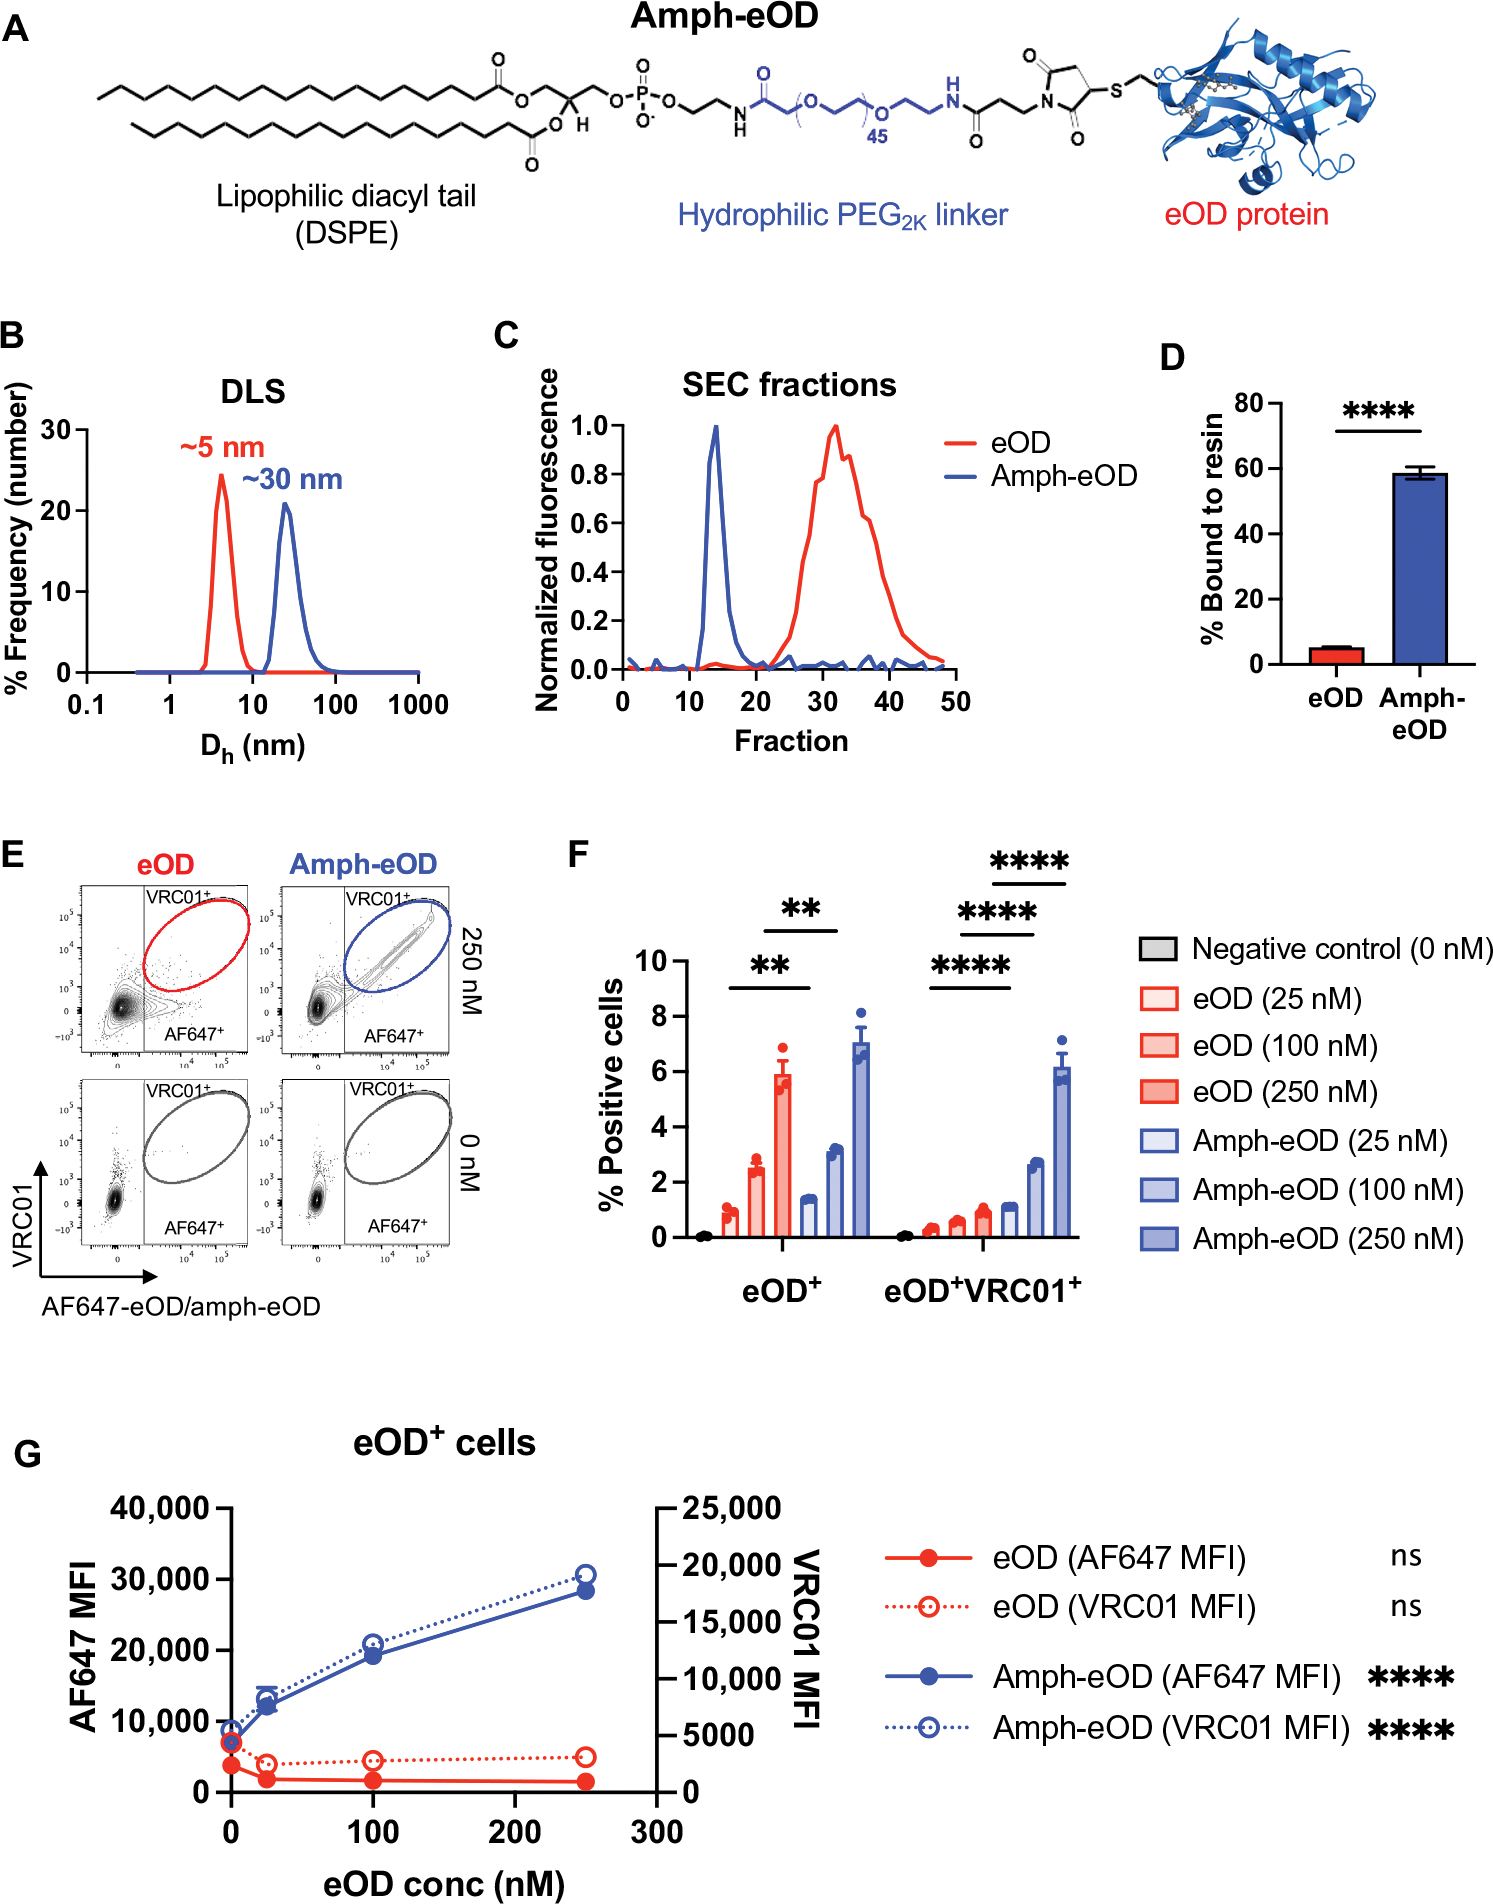
Fig. 1. Synthesis of albumin-binding amphiphile-protein immunogen conjugates.

(A) A schematic of amph-eOD structure is shown. (B) Dynamic light scattering (DLS) analysis of eOD and amph-eOD is shown as number-weighted % frequency. Dh, hydrodynamic diameter. (C) Size exclusion chromatography (SEC) profiles of eOD and amph-eOD are shown. (D) AF647-eOD or AF647-amph-eOD protein were incubated with albumin-functionalized agarose resin at 37°C, and the quantity of each protein bound to the resin after 2 hours was quantified. Statistical significance was determined by unpaired t test. (E to G) Fluorescent eOD or amph-eOD were incubated with murine C57BL/6 splenocytes for 1 hour at 37°C at a range of concentrations and then washed and stained with fluorescent VRC01 antibody. (E) Representative flow cytometry plots are shown of eOD/amph-eOD and VRC01 binding to the cells. (F) The percentage of cells positive for eOD alone or double positive for eOD and VRC01 was quantified; statistical significance was determined by two-way ANOVA followed by Sidak’s post hoc test. (G) Mean fluorescence intensity (MFI) of eOD and VRC01 is shown as a function of eOD concentration; statistically significant nonzero slope was determined by simple linear regression. All data are presented as means ± SEM. **P < 0.01 and ****P < 0.0001; ns, not significant.
